

Howard Marks put it nicely when he said that, rather than worrying about share price volatility, 'The possibility of permanent loss is the risk I worry about... and every practical investor I know worries about.' When we think about how risky a company is, we always like to look at its use of debt, since debt overload can lead to ruin. We note that BE Group AB (publ) (STO:BEGR) does have debt on its balance sheet. But the real question is whether this debt is making the company risky.
Why Does Debt Bring Risk?
Debt assists a business until the business has trouble paying it off, either with new capital or with free cash flow. Ultimately, if the company can't fulfill its legal obligations to repay debt, shareholders could walk away with nothing. However, a more usual (but still expensive) situation is where a company must dilute shareholders at a cheap share price simply to get debt under control. By replacing dilution, though, debt can be an extremely good tool for businesses that need capital to invest in growth at high rates of return. The first thing to do when considering how much debt a business uses is to look at its cash and debt together.
View our latest analysis for BE Group
What Is BE Group's Debt?
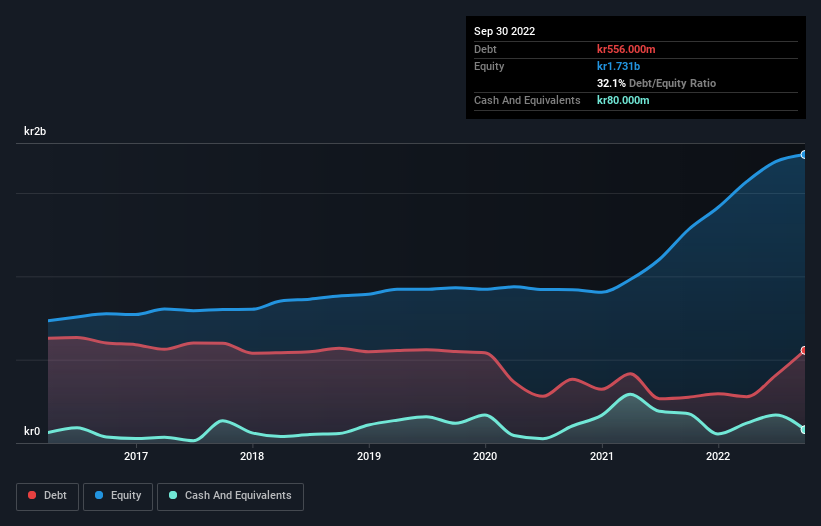
You can click the graphic below for the historical numbers, but it shows that as of September 2022 BE Group had kr556.0m of debt, an increase on kr275.0m, over one year. On the flip side, it has kr80.0m in cash leading to net debt of about kr476.0m.
How Healthy Is BE Group's Balance Sheet?
The latest balance sheet data shows that BE Group had liabilities of kr1.14b due within a year, and liabilities of kr1.02b falling due after that. Offsetting this, it had kr80.0m in cash and kr957.0m in receivables that were due within 12 months. So it has liabilities totalling kr1.12b more than its cash and near-term receivables, combined.
This is a mountain of leverage relative to its market capitalization of kr1.20b. Should its lenders demand that it shore up the balance sheet, shareholders would likely face severe dilution.
We use two main ratios to inform us about debt levels relative to earnings. The first is net debt divided by earnings before interest, tax, depreciation, and amortization (EBITDA), while the second is how many times its earnings before interest and tax (EBIT) covers its interest expense (or its interest cover, for short). Thus we consider debt relative to earnings both with and without depreciation and amortization expenses.
BE Group's net debt is only 0.71 times its EBITDA. And its EBIT covers its interest expense a whopping 43.3 times over. So you could argue it is no more threatened by its debt than an elephant is by a mouse. On top of that, BE Group grew its EBIT by 49% over the last twelve months, and that growth will make it easier to handle its debt. The balance sheet is clearly the area to focus on when you are analysing debt. But it is future earnings, more than anything, that will determine BE Group's ability to maintain a healthy balance sheet going forward. So if you want to see what the professionals think, you might find this free report on analyst profit forecasts to be interesting.
Finally, a company can only pay off debt with cold hard cash, not accounting profits. So we clearly need to look at whether that EBIT is leading to corresponding free cash flow. In the last three years, BE Group's free cash flow amounted to 35% of its EBIT, less than we'd expect. That's not great, when it comes to paying down debt.
Our View
Both BE Group's ability to to cover its interest expense with its EBIT and its EBIT growth rate gave us comfort that it can handle its debt. Having said that, its level of total liabilities somewhat sensitizes us to potential future risks to the balance sheet. When we consider all the elements mentioned above, it seems to us that BE Group is managing its debt quite well. Having said that, the load is sufficiently heavy that we would recommend any shareholders keep a close eye on it. There's no doubt that we learn most about debt from the balance sheet. But ultimately, every company can contain risks that exist outside of the balance sheet. To that end, you should learn about the 3 warning signs we've spotted with BE Group (including 2 which don't sit too well with us) .
Of course, if you're the type of investor who prefers buying stocks without the burden of debt, then don't hesitate to discover our exclusive list of net cash growth stocks, today.
Valuation is complex, but we're here to simplify it.
Discover if BE Group might be undervalued or overvalued with our detailed analysis, featuring fair value estimates, potential risks, dividends, insider trades, and its financial condition.
Access Free AnalysisHave feedback on this article? Concerned about the content? Get in touch with us directly. Alternatively, email editorial-team (at) simplywallst.com.
This article by Simply Wall St is general in nature. We provide commentary based on historical data and analyst forecasts only using an unbiased methodology and our articles are not intended to be financial advice. It does not constitute a recommendation to buy or sell any stock, and does not take account of your objectives, or your financial situation. We aim to bring you long-term focused analysis driven by fundamental data. Note that our analysis may not factor in the latest price-sensitive company announcements or qualitative material. Simply Wall St has no position in any stocks mentioned.
About OM:BEGR
BE Group
Operates as a trading and service company in steel, stainless steel, and aluminum products in Sweden, Poland, Finland, and Baltics.
Adequate balance sheet and slightly overvalued.
Similar Companies
Market Insights

Community Narratives

