

David Iben put it well when he said, 'Volatility is not a risk we care about. What we care about is avoiding the permanent loss of capital.' So it might be obvious that you need to consider debt, when you think about how risky any given stock is, because too much debt can sink a company. We can see that BE Group AB (publ) (STO:BEGR) does use debt in its business. But the real question is whether this debt is making the company risky.
When Is Debt Dangerous?
Debt and other liabilities become risky for a business when it cannot easily fulfill those obligations, either with free cash flow or by raising capital at an attractive price. Ultimately, if the company can't fulfill its legal obligations to repay debt, shareholders could walk away with nothing. However, a more usual (but still expensive) situation is where a company must dilute shareholders at a cheap share price simply to get debt under control. Of course, debt can be an important tool in businesses, particularly capital heavy businesses. The first step when considering a company's debt levels is to consider its cash and debt together.
Check out our latest analysis for BE Group
What Is BE Group's Debt?
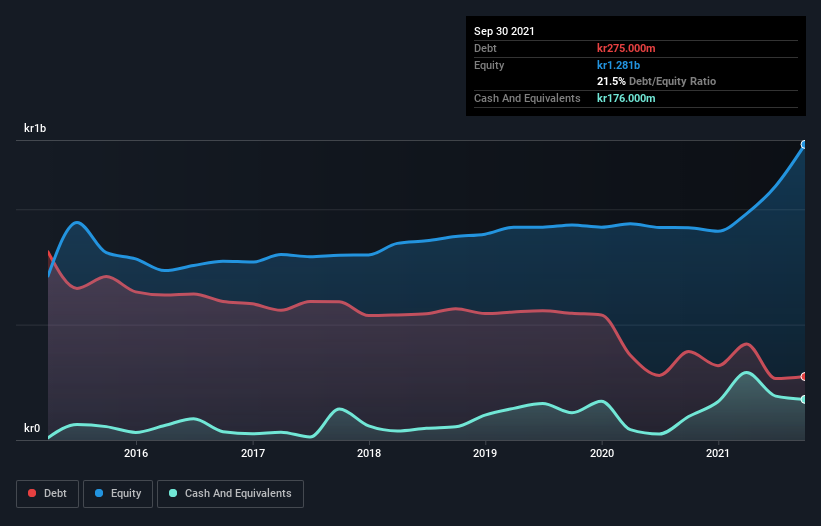
The image below, which you can click on for greater detail, shows that BE Group had debt of kr275.0m at the end of September 2021, a reduction from kr383.0m over a year. However, because it has a cash reserve of kr176.0m, its net debt is less, at about kr99.0m.
A Look At BE Group's Liabilities
The latest balance sheet data shows that BE Group had liabilities of kr1.17b due within a year, and liabilities of kr720.0m falling due after that. Offsetting these obligations, it had cash of kr176.0m as well as receivables valued at kr900.0m due within 12 months. So it has liabilities totalling kr817.0m more than its cash and near-term receivables, combined.
This deficit isn't so bad because BE Group is worth kr1.60b, and thus could probably raise enough capital to shore up its balance sheet, if the need arose. But it's clear that we should definitely closely examine whether it can manage its debt without dilution.
In order to size up a company's debt relative to its earnings, we calculate its net debt divided by its earnings before interest, tax, depreciation, and amortization (EBITDA) and its earnings before interest and tax (EBIT) divided by its interest expense (its interest cover). Thus we consider debt relative to earnings both with and without depreciation and amortization expenses.
BE Group's net debt is only 0.22 times its EBITDA. And its EBIT covers its interest expense a whopping 29.0 times over. So we're pretty relaxed about its super-conservative use of debt. Even more impressive was the fact that BE Group grew its EBIT by 590% over twelve months. That boost will make it even easier to pay down debt going forward. When analysing debt levels, the balance sheet is the obvious place to start. But ultimately the future profitability of the business will decide if BE Group can strengthen its balance sheet over time. So if you want to see what the professionals think, you might find this free report on analyst profit forecasts to be interesting.
Finally, a company can only pay off debt with cold hard cash, not accounting profits. So it's worth checking how much of that EBIT is backed by free cash flow. Over the last three years, BE Group actually produced more free cash flow than EBIT. That sort of strong cash generation warms our hearts like a puppy in a bumblebee suit.
Our View
BE Group's interest cover suggests it can handle its debt as easily as Cristiano Ronaldo could score a goal against an under 14's goalkeeper. But, on a more sombre note, we are a little concerned by its level of total liabilities. Looking at the bigger picture, we think BE Group's use of debt seems quite reasonable and we're not concerned about it. While debt does bring risk, when used wisely it can also bring a higher return on equity. When analysing debt levels, the balance sheet is the obvious place to start. However, not all investment risk resides within the balance sheet - far from it. Be aware that BE Group is showing 1 warning sign in our investment analysis , you should know about...
At the end of the day, it's often better to focus on companies that are free from net debt. You can access our special list of such companies (all with a track record of profit growth). It's free.
If you're looking to trade BE Group, open an account with the lowest-cost platform trusted by professionals, Interactive Brokers.
With clients in over 200 countries and territories, and access to 160 markets, IBKR lets you trade stocks, options, futures, forex, bonds and funds from a single integrated account.
Enjoy no hidden fees, no account minimums, and FX conversion rates as low as 0.03%, far better than what most brokers offer.
Sponsored ContentValuation is complex, but we're here to simplify it.
Discover if BE Group might be undervalued or overvalued with our detailed analysis, featuring fair value estimates, potential risks, dividends, insider trades, and its financial condition.
Access Free AnalysisHave feedback on this article? Concerned about the content? Get in touch with us directly. Alternatively, email editorial-team (at) simplywallst.com.
This article by Simply Wall St is general in nature. We provide commentary based on historical data and analyst forecasts only using an unbiased methodology and our articles are not intended to be financial advice. It does not constitute a recommendation to buy or sell any stock, and does not take account of your objectives, or your financial situation. We aim to bring you long-term focused analysis driven by fundamental data. Note that our analysis may not factor in the latest price-sensitive company announcements or qualitative material. Simply Wall St has no position in any stocks mentioned.
About OM:BEGR
BE Group
Operates as a trading and service company in steel, stainless steel, and aluminum products in Sweden, Poland, Finland, and Baltics.
Adequate balance sheet and slightly overvalued.
Similar Companies
Market Insights

Community Narratives

