

Legendary fund manager Li Lu (who Charlie Munger backed) once said, 'The biggest investment risk is not the volatility of prices, but whether you will suffer a permanent loss of capital.' When we think about how risky a company is, we always like to look at its use of debt, since debt overload can lead to ruin. We can see that BE Group AB (publ) (STO:BEGR) does use debt in its business. But the more important question is: how much risk is that debt creating?
When Is Debt A Problem?
Debt is a tool to help businesses grow, but if a business is incapable of paying off its lenders, then it exists at their mercy. Part and parcel of capitalism is the process of 'creative destruction' where failed businesses are mercilessly liquidated by their bankers. However, a more frequent (but still costly) occurrence is where a company must issue shares at bargain-basement prices, permanently diluting shareholders, just to shore up its balance sheet. Having said that, the most common situation is where a company manages its debt reasonably well - and to its own advantage. The first thing to do when considering how much debt a business uses is to look at its cash and debt together.
See our latest analysis for BE Group
What Is BE Group's Net Debt?
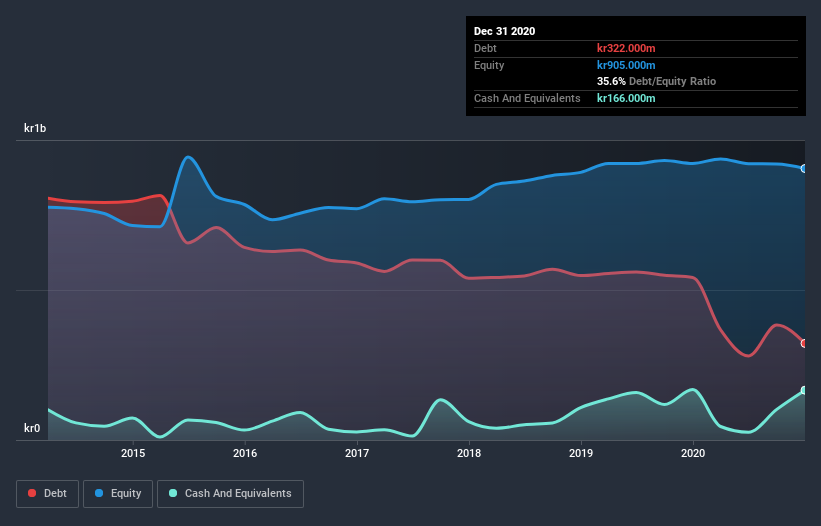
The image below, which you can click on for greater detail, shows that BE Group had debt of kr322.0m at the end of December 2020, a reduction from kr542.0m over a year. However, because it has a cash reserve of kr166.0m, its net debt is less, at about kr156.0m.
How Strong Is BE Group's Balance Sheet?
Zooming in on the latest balance sheet data, we can see that BE Group had liabilities of kr693.0m due within 12 months and liabilities of kr820.0m due beyond that. On the other hand, it had cash of kr166.0m and kr418.0m worth of receivables due within a year. So its liabilities total kr929.0m more than the combination of its cash and short-term receivables.
The deficiency here weighs heavily on the kr551.8m company itself, as if a child were struggling under the weight of an enormous back-pack full of books, his sports gear, and a trumpet. So we'd watch its balance sheet closely, without a doubt. At the end of the day, BE Group would probably need a major re-capitalization if its creditors were to demand repayment.
In order to size up a company's debt relative to its earnings, we calculate its net debt divided by its earnings before interest, tax, depreciation, and amortization (EBITDA) and its earnings before interest and tax (EBIT) divided by its interest expense (its interest cover). The advantage of this approach is that we take into account both the absolute quantum of debt (with net debt to EBITDA) and the actual interest expenses associated with that debt (with its interest cover ratio).
BE Group has net debt worth 1.6 times EBITDA, which isn't too much, but its interest cover looks a bit on the low side, with EBIT at only 4.0 times the interest expense. While that doesn't worry us too much, it does suggest the interest payments are somewhat of a burden. The bad news is that BE Group saw its EBIT decline by 14% over the last year. If earnings continue to decline at that rate then handling the debt will be more difficult than taking three children under 5 to a fancy pants restaurant. The balance sheet is clearly the area to focus on when you are analysing debt. But it is future earnings, more than anything, that will determine BE Group's ability to maintain a healthy balance sheet going forward. So if you want to see what the professionals think, you might find this free report on analyst profit forecasts to be interesting.
But our final consideration is also important, because a company cannot pay debt with paper profits; it needs cold hard cash. So we clearly need to look at whether that EBIT is leading to corresponding free cash flow. Happily for any shareholders, BE Group actually produced more free cash flow than EBIT over the last three years. There's nothing better than incoming cash when it comes to staying in your lenders' good graces.
Our View
Mulling over BE Group's attempt at staying on top of its total liabilities, we're certainly not enthusiastic. But on the bright side, its conversion of EBIT to free cash flow is a good sign, and makes us more optimistic. Overall, we think it's fair to say that BE Group has enough debt that there are some real risks around the balance sheet. If all goes well, that should boost returns, but on the flip side, the risk of permanent capital loss is elevated by the debt. When analysing debt levels, the balance sheet is the obvious place to start. But ultimately, every company can contain risks that exist outside of the balance sheet. For example, we've discovered 3 warning signs for BE Group that you should be aware of before investing here.
When all is said and done, sometimes its easier to focus on companies that don't even need debt. Readers can access a list of growth stocks with zero net debt 100% free, right now.
If you’re looking to trade BE Group, open an account with the lowest-cost* platform trusted by professionals, Interactive Brokers. Their clients from over 200 countries and territories trade stocks, options, futures, forex, bonds and funds worldwide from a single integrated account. Promoted
Valuation is complex, but we're here to simplify it.
Discover if BE Group might be undervalued or overvalued with our detailed analysis, featuring fair value estimates, potential risks, dividends, insider trades, and its financial condition.
Access Free AnalysisThis article by Simply Wall St is general in nature. It does not constitute a recommendation to buy or sell any stock, and does not take account of your objectives, or your financial situation. We aim to bring you long-term focused analysis driven by fundamental data. Note that our analysis may not factor in the latest price-sensitive company announcements or qualitative material. Simply Wall St has no position in any stocks mentioned.
*Interactive Brokers Rated Lowest Cost Broker by StockBrokers.com Annual Online Review 2020
Have feedback on this article? Concerned about the content? Get in touch with us directly. Alternatively, email editorial-team (at) simplywallst.com.
About OM:BEGR
BE Group
Operates as a trading and service company in steel, stainless steel, and aluminum products in Sweden, Poland, Finland, and Baltics.
Adequate balance sheet and slightly overvalued.
Similar Companies
Market Insights

Community Narratives

