

David Iben put it well when he said, 'Volatility is not a risk we care about. What we care about is avoiding the permanent loss of capital.' So it might be obvious that you need to consider debt, when you think about how risky any given stock is, because too much debt can sink a company. Importantly, AQ Group AB (publ) (STO:AQ) does carry debt. But is this debt a concern to shareholders?
When Is Debt Dangerous?
Generally speaking, debt only becomes a real problem when a company can't easily pay it off, either by raising capital or with its own cash flow. In the worst case scenario, a company can go bankrupt if it cannot pay its creditors. However, a more frequent (but still costly) occurrence is where a company must issue shares at bargain-basement prices, permanently diluting shareholders, just to shore up its balance sheet. Of course, the upside of debt is that it often represents cheap capital, especially when it replaces dilution in a company with the ability to reinvest at high rates of return. When we examine debt levels, we first consider both cash and debt levels, together.
View our latest analysis for AQ Group
What Is AQ Group's Net Debt?
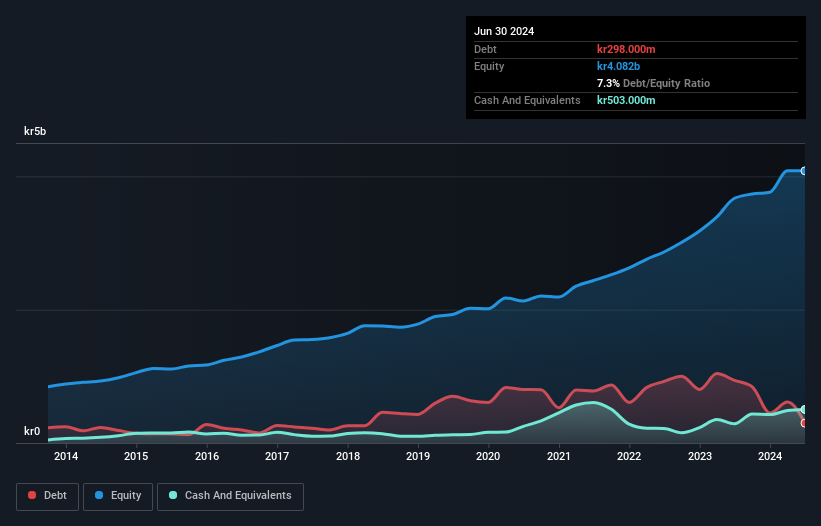
The image below, which you can click on for greater detail, shows that AQ Group had debt of kr298.0m at the end of June 2024, a reduction from kr940.0m over a year. But on the other hand it also has kr503.0m in cash, leading to a kr205.0m net cash position.
How Healthy Is AQ Group's Balance Sheet?
The latest balance sheet data shows that AQ Group had liabilities of kr1.65b due within a year, and liabilities of kr658.0m falling due after that. On the other hand, it had cash of kr503.0m and kr2.25b worth of receivables due within a year. So it actually has kr452.0m more liquid assets than total liabilities.
This short term liquidity is a sign that AQ Group could probably pay off its debt with ease, as its balance sheet is far from stretched. Simply put, the fact that AQ Group has more cash than debt is arguably a good indication that it can manage its debt safely.
Another good sign is that AQ Group has been able to increase its EBIT by 30% in twelve months, making it easier to pay down debt. When analysing debt levels, the balance sheet is the obvious place to start. But you can't view debt in total isolation; since AQ Group will need earnings to service that debt. So if you're keen to discover more about its earnings, it might be worth checking out this graph of its long term earnings trend.
Finally, a company can only pay off debt with cold hard cash, not accounting profits. AQ Group may have net cash on the balance sheet, but it is still interesting to look at how well the business converts its earnings before interest and tax (EBIT) to free cash flow, because that will influence both its need for, and its capacity to manage debt. Looking at the most recent three years, AQ Group recorded free cash flow of 50% of its EBIT, which is weaker than we'd expect. That weak cash conversion makes it more difficult to handle indebtedness.
Summing Up
While it is always sensible to investigate a company's debt, in this case AQ Group has kr205.0m in net cash and a decent-looking balance sheet. And we liked the look of last year's 30% year-on-year EBIT growth. So we don't think AQ Group's use of debt is risky. We'd be very excited to see if AQ Group insiders have been snapping up shares. If you are too, then click on this link right now to take a (free) peek at our list of reported insider transactions.
Of course, if you're the type of investor who prefers buying stocks without the burden of debt, then don't hesitate to discover our exclusive list of net cash growth stocks, today.
If you're looking to trade AQ Group, open an account with the lowest-cost platform trusted by professionals, Interactive Brokers.
With clients in over 200 countries and territories, and access to 160 markets, IBKR lets you trade stocks, options, futures, forex, bonds and funds from a single integrated account.
Enjoy no hidden fees, no account minimums, and FX conversion rates as low as 0.03%, far better than what most brokers offer.
Sponsored ContentNew: Manage All Your Stock Portfolios in One Place
We've created the ultimate portfolio companion for stock investors, and it's free.
• Connect an unlimited number of Portfolios and see your total in one currency
• Be alerted to new Warning Signs or Risks via email or mobile
• Track the Fair Value of your stocks
Have feedback on this article? Concerned about the content? Get in touch with us directly. Alternatively, email editorial-team (at) simplywallst.com.
This article by Simply Wall St is general in nature. We provide commentary based on historical data and analyst forecasts only using an unbiased methodology and our articles are not intended to be financial advice. It does not constitute a recommendation to buy or sell any stock, and does not take account of your objectives, or your financial situation. We aim to bring you long-term focused analysis driven by fundamental data. Note that our analysis may not factor in the latest price-sensitive company announcements or qualitative material. Simply Wall St has no position in any stocks mentioned.
Have feedback on this article? Concerned about the content? Get in touch with us directly. Alternatively, email editorial-team@simplywallst.com
About OM:AQ
AQ Group
Develops, manufactures, and assembles components and systems for industrial customers in Sweden, other European countries, and internationally.
Flawless balance sheet with proven track record.
Similar Companies
Market Insights

Community Narratives

