- Saudi Arabia
- /
- Real Estate
- /
- SASE:4321
The five-year returns for Arabian Centres' (TADAWUL:4321) shareholders have been , yet its earnings growth was even better


While not a mind-blowing move, it is good to see that the Arabian Centres Company (TADAWUL:4321) share price has gained 11% in the last three months. But if you look at the last five years the returns have not been good. You would have done a lot better buying an index fund, since the stock has dropped 25% in that half decade.
The recent uptick of 5.2% could be a positive sign of things to come, so let's take a look at historical fundamentals.
View our latest analysis for Arabian Centres
To paraphrase Benjamin Graham: Over the short term the market is a voting machine, but over the long term it's a weighing machine. By comparing earnings per share (EPS) and share price changes over time, we can get a feel for how investor attitudes to a company have morphed over time.
While the share price declined over five years, Arabian Centres actually managed to increase EPS by an average of 5.8% per year. So it doesn't seem like EPS is a great guide to understanding how the market is valuing the stock. Or possibly, the market was previously very optimistic, so the stock has disappointed, despite improving EPS.
Due to the lack of correlation between the EPS growth and the falling share price, it's worth taking a look at other metrics to try to understand the share price movement.
The steady dividend doesn't really explain why the share price is down. It's not immediately clear to us why the stock price is down but further research might provide some answers.
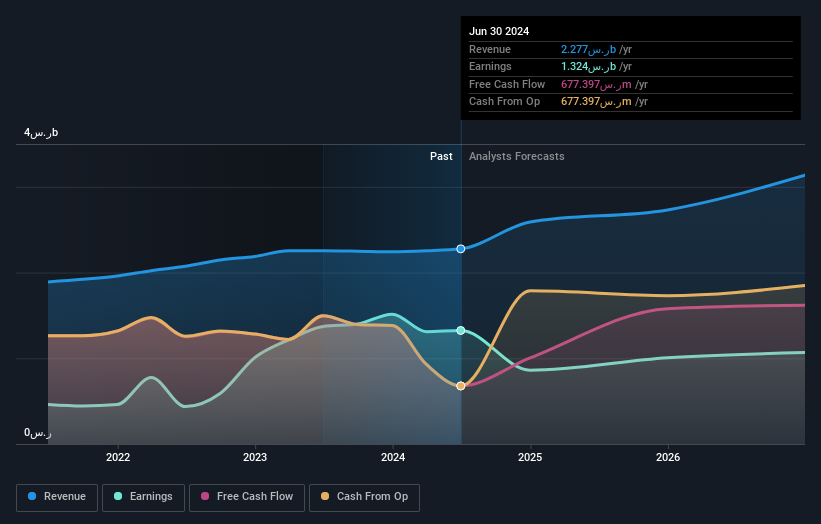
The graphic below depicts how earnings and revenue have changed over time (unveil the exact values by clicking on the image).
It is of course excellent to see how Arabian Centres has grown profits over the years, but the future is more important for shareholders. It might be well worthwhile taking a look at our free report on how its financial position has changed over time.
What About Dividends?
As well as measuring the share price return, investors should also consider the total shareholder return (TSR). Whereas the share price return only reflects the change in the share price, the TSR includes the value of dividends (assuming they were reinvested) and the benefit of any discounted capital raising or spin-off. Arguably, the TSR gives a more comprehensive picture of the return generated by a stock. As it happens, Arabian Centres' TSR for the last 5 years was 5.1%, which exceeds the share price return mentioned earlier. This is largely a result of its dividend payments!
A Different Perspective
It's good to see that Arabian Centres has rewarded shareholders with a total shareholder return of 16% in the last twelve months. And that does include the dividend. That gain is better than the annual TSR over five years, which is 1.0%. Therefore it seems like sentiment around the company has been positive lately. Given the share price momentum remains strong, it might be worth taking a closer look at the stock, lest you miss an opportunity. I find it very interesting to look at share price over the long term as a proxy for business performance. But to truly gain insight, we need to consider other information, too. Take risks, for example - Arabian Centres has 4 warning signs (and 2 which are a bit unpleasant) we think you should know about.
If you are like me, then you will not want to miss this free list of undervalued small caps that insiders are buying.
Please note, the market returns quoted in this article reflect the market weighted average returns of stocks that currently trade on Saudi exchanges.
New: Manage All Your Stock Portfolios in One Place
We've created the ultimate portfolio companion for stock investors, and it's free.
• Connect an unlimited number of Portfolios and see your total in one currency
• Be alerted to new Warning Signs or Risks via email or mobile
• Track the Fair Value of your stocks
Have feedback on this article? Concerned about the content? Get in touch with us directly. Alternatively, email editorial-team (at) simplywallst.com.
This article by Simply Wall St is general in nature. We provide commentary based on historical data and analyst forecasts only using an unbiased methodology and our articles are not intended to be financial advice. It does not constitute a recommendation to buy or sell any stock, and does not take account of your objectives, or your financial situation. We aim to bring you long-term focused analysis driven by fundamental data. Note that our analysis may not factor in the latest price-sensitive company announcements or qualitative material. Simply Wall St has no position in any stocks mentioned.
About SASE:4321
Arabian Centres
Owns, develops, and operates lifestyle centers in the Kingdom of Saudi Arabia.
Slight and fair value.

