
Advertisement
- Saudi Arabia
- /
- Pharma
- /
- SASE:4016
Middle East Pharmaceutical Industries Company's (TADAWUL:4016) Stock Has Shown Weakness Lately But Financial Prospects Look Decent: Is The Market Wrong?

With its stock down 21% over the past three months, it is easy to disregard Middle East Pharmaceutical Industries (TADAWUL:4016). But if you pay close attention, you might find that its key financial indicators look quite decent, which could mean that the stock could potentially rise in the long-term given how markets usually reward more resilient long-term fundamentals. In this article, we decided to focus on Middle East Pharmaceutical Industries' ROE.
Return on Equity or ROE is a test of how effectively a company is growing its value and managing investors’ money. Simply put, it is used to assess the profitability of a company in relation to its equity capital.
See our latest analysis for Middle East Pharmaceutical Industries
How Do You Calculate Return On Equity?
ROE can be calculated by using the formula:
Return on Equity = Net Profit (from continuing operations) ÷ Shareholders' Equity
So, based on the above formula, the ROE for Middle East Pharmaceutical Industries is:
24% = ر.س76m ÷ ر.س315m (Based on the trailing twelve months to March 2024).
The 'return' is the yearly profit. So, this means that for every SAR1 of its shareholder's investments, the company generates a profit of SAR0.24.
What Has ROE Got To Do With Earnings Growth?
So far, we've learned that ROE is a measure of a company's profitability. Based on how much of its profits the company chooses to reinvest or "retain", we are then able to evaluate a company's future ability to generate profits. Assuming everything else remains unchanged, the higher the ROE and profit retention, the higher the growth rate of a company compared to companies that don't necessarily bear these characteristics.
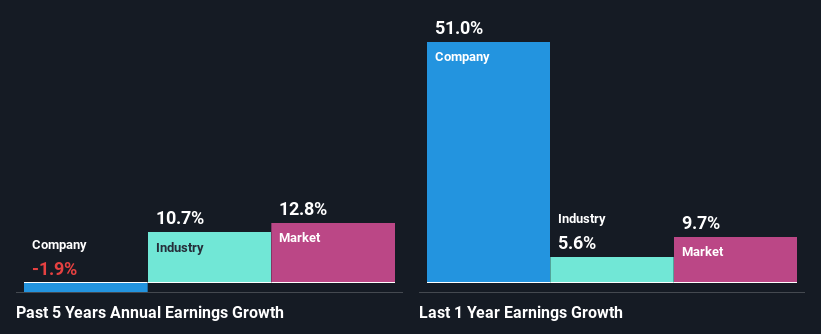
Middle East Pharmaceutical Industries' Earnings Growth And 24% ROE
To start with, Middle East Pharmaceutical Industries' ROE looks acceptable. On comparing with the average industry ROE of 9.0% the company's ROE looks pretty remarkable. Despite this, Middle East Pharmaceutical Industries' five year net income growth was quite flat over the past five years. Therefore, there could be some other aspects that could potentially be preventing the company from growing. These include low earnings retention or poor allocation of capital.
We then compared Middle East Pharmaceutical Industries' net income growth with the industry and found that the average industry growth rate was 11% in the same 5-year period.
The basis for attaching value to a company is, to a great extent, tied to its earnings growth. It’s important for an investor to know whether the market has priced in the company's expected earnings growth (or decline). This then helps them determine if the stock is placed for a bright or bleak future. Is Middle East Pharmaceutical Industries fairly valued compared to other companies? These 3 valuation measures might help you decide.
Is Middle East Pharmaceutical Industries Using Its Retained Earnings Effectively?
Middle East Pharmaceutical Industries doesn't pay any regular dividends, meaning that the company is keeping all of its profits, which makes us wonder why it is retaining its earnings if it can't use them to grow its business. So there could be some other explanations in that regard. For instance, the company's business may be deteriorating.
Summary
On the whole, we do feel that Middle East Pharmaceutical Industries has some positive attributes. However, given the high ROE and high profit retention, we would expect the company to be delivering strong earnings growth, but that isn't the case here. This suggests that there might be some external threat to the business, that's hampering its growth. Up till now, we've only made a short study of the company's growth data. You can do your own research on Middle East Pharmaceutical Industries and see how it has performed in the past by looking at this FREE detailed graph of past earnings, revenue and cash flows.
New: Manage All Your Stock Portfolios in One Place
We've created the ultimate portfolio companion for stock investors, and it's free.
• Connect an unlimited number of Portfolios and see your total in one currency
• Be alerted to new Warning Signs or Risks via email or mobile
• Track the Fair Value of your stocks
Have feedback on this article? Concerned about the content? Get in touch with us directly. Alternatively, email editorial-team (at) simplywallst.com.
This article by Simply Wall St is general in nature. We provide commentary based on historical data and analyst forecasts only using an unbiased methodology and our articles are not intended to be financial advice. It does not constitute a recommendation to buy or sell any stock, and does not take account of your objectives, or your financial situation. We aim to bring you long-term focused analysis driven by fundamental data. Note that our analysis may not factor in the latest price-sensitive company announcements or qualitative material. Simply Wall St has no position in any stocks mentioned.
Have feedback on this article? Concerned about the content? Get in touch with us directly. Alternatively, email editorial-team@simplywallst.com
About SASE:4016
Middle East Pharmaceutical Industries
Engages in the research, development, manufacture, and marketing of generic medicines and pharmaceutical preparations in the Kingdom of Saudi Arabia and internationally.
Solid track record with excellent balance sheet.
Market Insights

Advertisement
Community Narratives
Pinterest will surge as advertising innovations ignite revenue growth
Fair Value US$42.63|27.1% undervalued
BR
Community Contributor
Brambles' Revenue Set to Climb 14% with Profit Margins Following
Fair Value AU$21.90|5.9% overvalued
RO
Community Contributor
Challenging Future for STG as Organic Sales Decline by 8.8%
Fair Value DKK 116.13|26.8% undervalued
KA
Community Contributor