- Saudi Arabia
- /
- Basic Materials
- /
- SASE:3092
A Look At The Fair Value Of Riyadh Cement Company (TADAWUL:9512)

Key Insights
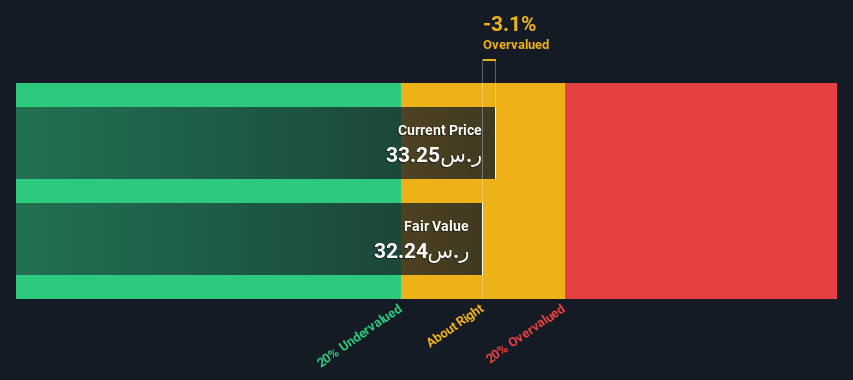
- The projected fair value for Riyadh Cement is ر.س32.24 based on 2 Stage Free Cash Flow to Equity
- Current share price of ر.س33.25 suggests Riyadh Cement is potentially trading close to its fair value
- Industry average of 173% suggests Riyadh Cement's peers are currently trading at a higher premium to fair value
Does the August share price for Riyadh Cement Company (TADAWUL:9512) reflect what it's really worth? Today, we will estimate the stock's intrinsic value by taking the expected future cash flows and discounting them to today's value. We will take advantage of the Discounted Cash Flow (DCF) model for this purpose. Before you think you won't be able to understand it, just read on! It's actually much less complex than you'd imagine.
We would caution that there are many ways of valuing a company and, like the DCF, each technique has advantages and disadvantages in certain scenarios. If you want to learn more about discounted cash flow, the rationale behind this calculation can be read in detail in the Simply Wall St analysis model.
See our latest analysis for Riyadh Cement
Crunching The Numbers
We use what is known as a 2-stage model, which simply means we have two different periods of growth rates for the company's cash flows. Generally the first stage is higher growth, and the second stage is a lower growth phase. In the first stage we need to estimate the cash flows to the business over the next ten years. Seeing as no analyst estimates of free cash flow are available to us, we have extrapolate the previous free cash flow (FCF) from the company's last reported value. We assume companies with shrinking free cash flow will slow their rate of shrinkage, and that companies with growing free cash flow will see their growth rate slow, over this period. We do this to reflect that growth tends to slow more in the early years than it does in later years.
A DCF is all about the idea that a dollar in the future is less valuable than a dollar today, and so the sum of these future cash flows is then discounted to today's value:
10-year free cash flow (FCF) estimate
| 2024 | 2025 | 2026 | 2027 | 2028 | 2029 | 2030 | 2031 | 2032 | 2033 | |
| Levered FCF (SAR, Millions) | ر.س267.7m | ر.س280.8m | ر.س298.0m | ر.س318.8m | ر.س342.9m | ر.س370.4m | ر.س401.1m | ر.س435.2m | ر.س472.9m | ر.س514.3m |
| Growth Rate Estimate Source | Est @ 3.12% | Est @ 4.88% | Est @ 6.11% | Est @ 6.98% | Est @ 7.58% | Est @ 8.00% | Est @ 8.30% | Est @ 8.51% | Est @ 8.65% | Est @ 8.75% |
| Present Value (SAR, Millions) Discounted @ 15% | ر.س232 | ر.س211 | ر.س195 | ر.س181 | ر.س169 | ر.س158 | ر.س149 | ر.س140 | ر.س132 | ر.س125 |
("Est" = FCF growth rate estimated by Simply Wall St)
Present Value of 10-year Cash Flow (PVCF) = ر.س1.7b
After calculating the present value of future cash flows in the initial 10-year period, we need to calculate the Terminal Value, which accounts for all future cash flows beyond the first stage. The Gordon Growth formula is used to calculate Terminal Value at a future annual growth rate equal to the 5-year average of the 10-year government bond yield of 9.0%. We discount the terminal cash flows to today's value at a cost of equity of 15%.
Terminal Value (TV)= FCF2033 × (1 + g) ÷ (r – g) = ر.س514m× (1 + 9.0%) ÷ (15%– 9.0%) = ر.س9.0b
Present Value of Terminal Value (PVTV)= TV / (1 + r)10= ر.س9.0b÷ ( 1 + 15%)10= ر.س2.2b
The total value, or equity value, is then the sum of the present value of the future cash flows, which in this case is ر.س3.9b. To get the intrinsic value per share, we divide this by the total number of shares outstanding. Relative to the current share price of ر.س33.3, the company appears around fair value at the time of writing. Valuations are imprecise instruments though, rather like a telescope - move a few degrees and end up in a different galaxy. Do keep this in mind.
The Assumptions
The calculation above is very dependent on two assumptions. The first is the discount rate and the other is the cash flows. Part of investing is coming up with your own evaluation of a company's future performance, so try the calculation yourself and check your own assumptions. The DCF also does not consider the possible cyclicality of an industry, or a company's future capital requirements, so it does not give a full picture of a company's potential performance. Given that we are looking at Riyadh Cement as potential shareholders, the cost of equity is used as the discount rate, rather than the cost of capital (or weighted average cost of capital, WACC) which accounts for debt. In this calculation we've used 15%, which is based on a levered beta of 0.871. Beta is a measure of a stock's volatility, compared to the market as a whole. We get our beta from the industry average beta of globally comparable companies, with an imposed limit between 0.8 and 2.0, which is a reasonable range for a stable business.
SWOT Analysis for Riyadh Cement
- Currently debt free.
- Dividend is in the top 25% of dividend payers in the market.
- Earnings declined over the past year.
- Annual earnings are forecast to grow faster than the Saudi market.
- Good value based on P/E ratio compared to estimated Fair P/E ratio.
- Dividends are not covered by earnings.
Next Steps:
Although the valuation of a company is important, it ideally won't be the sole piece of analysis you scrutinize for a company. It's not possible to obtain a foolproof valuation with a DCF model. Instead the best use for a DCF model is to test certain assumptions and theories to see if they would lead to the company being undervalued or overvalued. For instance, if the terminal value growth rate is adjusted slightly, it can dramatically alter the overall result. For Riyadh Cement, we've put together three further aspects you should further examine:
- Risks: For example, we've discovered 1 warning sign for Riyadh Cement that you should be aware of before investing here.
- Future Earnings: How does 9512's growth rate compare to its peers and the wider market? Dig deeper into the analyst consensus number for the upcoming years by interacting with our free analyst growth expectation chart.
- Other High Quality Alternatives: Do you like a good all-rounder? Explore our interactive list of high quality stocks to get an idea of what else is out there you may be missing!
PS. Simply Wall St updates its DCF calculation for every Saudi stock every day, so if you want to find the intrinsic value of any other stock just search here.
If you're looking to trade Riyadh Cement, open an account with the lowest-cost platform trusted by professionals, Interactive Brokers.
With clients in over 200 countries and territories, and access to 160 markets, IBKR lets you trade stocks, options, futures, forex, bonds and funds from a single integrated account.
Enjoy no hidden fees, no account minimums, and FX conversion rates as low as 0.03%, far better than what most brokers offer.
Sponsored ContentNew: AI Stock Screener & Alerts
Our new AI Stock Screener scans the market every day to uncover opportunities.
• Dividend Powerhouses (3%+ Yield)
• Undervalued Small Caps with Insider Buying
• High growth Tech and AI Companies
Or build your own from over 50 metrics.
Have feedback on this article? Concerned about the content? Get in touch with us directly. Alternatively, email editorial-team (at) simplywallst.com.
This article by Simply Wall St is general in nature. We provide commentary based on historical data and analyst forecasts only using an unbiased methodology and our articles are not intended to be financial advice. It does not constitute a recommendation to buy or sell any stock, and does not take account of your objectives, or your financial situation. We aim to bring you long-term focused analysis driven by fundamental data. Note that our analysis may not factor in the latest price-sensitive company announcements or qualitative material. Simply Wall St has no position in any stocks mentioned.
About SASE:3092
Riyadh Cement
Produces and sells cement in the Kingdom of Saudi Arabia, the Kingdom of Bahrain, the Hashemite Kingdom of Jordan, the State of Kuwait, the State of Qatar, and the Sultanate of Oman.
Flawless balance sheet with solid track record and pays a dividend.
Market Insights

Community Narratives

