- Saudi Arabia
- /
- Basic Materials
- /
- SASE:3040
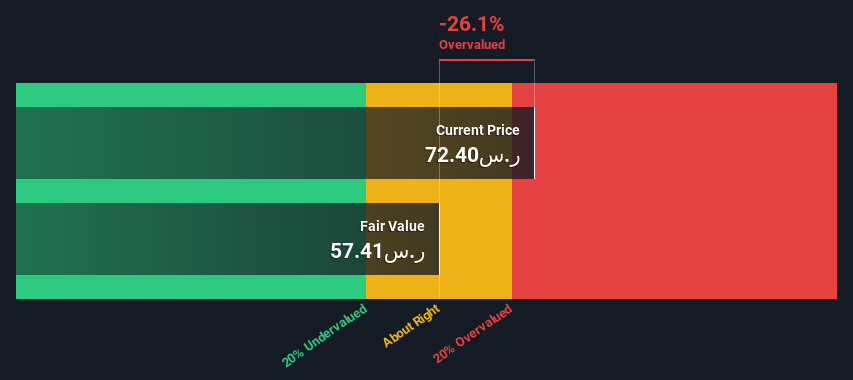
Qassim Cement Company (TADAWUL:3040) Shares Could Be 26% Above Their Intrinsic Value Estimate


Key Insights
- Using the 2 Stage Free Cash Flow to Equity, Qassim Cement fair value estimate is ر.س57.41
- Qassim Cement's ر.س72.40 share price signals that it might be 26% overvalued
- Analyst price target for 3040 is ر.س59.10, which is 2.9% above our fair value estimate
Does the May share price for Qassim Cement Company (TADAWUL:3040) reflect what it's really worth? Today, we will estimate the stock's intrinsic value by taking the expected future cash flows and discounting them to today's value. One way to achieve this is by employing the Discounted Cash Flow (DCF) model. There's really not all that much to it, even though it might appear quite complex.
Companies can be valued in a lot of ways, so we would point out that a DCF is not perfect for every situation. Anyone interested in learning a bit more about intrinsic value should have a read of the Simply Wall St analysis model.
See our latest analysis for Qassim Cement
The Model
We are going to use a two-stage DCF model, which, as the name states, takes into account two stages of growth. The first stage is generally a higher growth period which levels off heading towards the terminal value, captured in the second 'steady growth' period. In the first stage we need to estimate the cash flows to the business over the next ten years. Where possible we use analyst estimates, but when these aren't available we extrapolate the previous free cash flow (FCF) from the last estimate or reported value. We assume companies with shrinking free cash flow will slow their rate of shrinkage, and that companies with growing free cash flow will see their growth rate slow, over this period. We do this to reflect that growth tends to slow more in the early years than it does in later years.
Generally we assume that a dollar today is more valuable than a dollar in the future, so we discount the value of these future cash flows to their estimated value in today's dollars:
10-year free cash flow (FCF) estimate
| 2023 | 2024 | 2025 | 2026 | 2027 | 2028 | 2029 | 2030 | 2031 | 2032 | |
| Levered FCF (SAR, Millions) | ر.س294.0m | ر.س330.0m | ر.س363.4m | ر.س398.9m | ر.س436.9m | ر.س477.9m | ر.س522.2m | ر.س570.1m | ر.س622.1m | ر.س678.6m |
| Growth Rate Estimate Source | Analyst x1 | Analyst x1 | Est @ 10.11% | Est @ 9.78% | Est @ 9.54% | Est @ 9.37% | Est @ 9.26% | Est @ 9.18% | Est @ 9.12% | Est @ 9.08% |
| Present Value (SAR, Millions) Discounted @ 15% | ر.س256 | ر.س250 | ر.س239 | ر.س228 | ر.س217 | ر.س207 | ر.س196 | ر.س186 | ر.س177 | ر.س168 |
("Est" = FCF growth rate estimated by Simply Wall St)
Present Value of 10-year Cash Flow (PVCF) = ر.س2.1b
After calculating the present value of future cash flows in the initial 10-year period, we need to calculate the Terminal Value, which accounts for all future cash flows beyond the first stage. The Gordon Growth formula is used to calculate Terminal Value at a future annual growth rate equal to the 5-year average of the 10-year government bond yield of 9.0%. We discount the terminal cash flows to today's value at a cost of equity of 15%.
Terminal Value (TV)= FCF2032 × (1 + g) ÷ (r – g) = ر.س679m× (1 + 9.0%) ÷ (15%– 9.0%) = ر.س12b
Present Value of Terminal Value (PVTV)= TV / (1 + r)10= ر.س12b÷ ( 1 + 15%)10= ر.س3.0b
The total value is the sum of cash flows for the next ten years plus the discounted terminal value, which results in the Total Equity Value, which in this case is ر.س5.2b. In the final step we divide the equity value by the number of shares outstanding. Compared to the current share price of ر.س72.4, the company appears slightly overvalued at the time of writing. Valuations are imprecise instruments though, rather like a telescope - move a few degrees and end up in a different galaxy. Do keep this in mind.
The Assumptions
The calculation above is very dependent on two assumptions. The first is the discount rate and the other is the cash flows. Part of investing is coming up with your own evaluation of a company's future performance, so try the calculation yourself and check your own assumptions. The DCF also does not consider the possible cyclicality of an industry, or a company's future capital requirements, so it does not give a full picture of a company's potential performance. Given that we are looking at Qassim Cement as potential shareholders, the cost of equity is used as the discount rate, rather than the cost of capital (or weighted average cost of capital, WACC) which accounts for debt. In this calculation we've used 15%, which is based on a levered beta of 0.839. Beta is a measure of a stock's volatility, compared to the market as a whole. We get our beta from the industry average beta of globally comparable companies, with an imposed limit between 0.8 and 2.0, which is a reasonable range for a stable business.
SWOT Analysis for Qassim Cement
- Currently debt free.
- Earnings declined over the past year.
- Dividend is low compared to the top 25% of dividend payers in the Basic Materials market.
- Expensive based on P/E ratio and estimated fair value.
- Annual earnings are forecast to grow faster than the Saudi market.
- Dividends are not covered by earnings and cashflows.
- Revenue is forecast to grow slower than 20% per year.
Looking Ahead:
Whilst important, the DCF calculation shouldn't be the only metric you look at when researching a company. It's not possible to obtain a foolproof valuation with a DCF model. Rather it should be seen as a guide to "what assumptions need to be true for this stock to be under/overvalued?" For example, changes in the company's cost of equity or the risk free rate can significantly impact the valuation. Why is the intrinsic value lower than the current share price? For Qassim Cement, we've compiled three fundamental items you should further examine:
- Risks: Every company has them, and we've spotted 2 warning signs for Qassim Cement (of which 1 is concerning!) you should know about.
- Future Earnings: How does 3040's growth rate compare to its peers and the wider market? Dig deeper into the analyst consensus number for the upcoming years by interacting with our free analyst growth expectation chart.
- Other Solid Businesses: Low debt, high returns on equity and good past performance are fundamental to a strong business. Why not explore our interactive list of stocks with solid business fundamentals to see if there are other companies you may not have considered!
PS. Simply Wall St updates its DCF calculation for every Saudi stock every day, so if you want to find the intrinsic value of any other stock just search here.
If you're looking to trade Qassim Cement, open an account with the lowest-cost platform trusted by professionals, Interactive Brokers.
With clients in over 200 countries and territories, and access to 160 markets, IBKR lets you trade stocks, options, futures, forex, bonds and funds from a single integrated account.
Enjoy no hidden fees, no account minimums, and FX conversion rates as low as 0.03%, far better than what most brokers offer.
Sponsored ContentValuation is complex, but we're here to simplify it.
Discover if Qassim Cement might be undervalued or overvalued with our detailed analysis, featuring fair value estimates, potential risks, dividends, insider trades, and its financial condition.
Access Free AnalysisHave feedback on this article? Concerned about the content? Get in touch with us directly. Alternatively, email editorial-team (at) simplywallst.com.
This article by Simply Wall St is general in nature. We provide commentary based on historical data and analyst forecasts only using an unbiased methodology and our articles are not intended to be financial advice. It does not constitute a recommendation to buy or sell any stock, and does not take account of your objectives, or your financial situation. We aim to bring you long-term focused analysis driven by fundamental data. Note that our analysis may not factor in the latest price-sensitive company announcements or qualitative material. Simply Wall St has no position in any stocks mentioned.
About SASE:3040
Qassim Cement
Engages in the manufacture and selling of cement in the Kingdom of Saudi Arabia.
Flawless balance sheet with proven track record.
Similar Companies
Market Insights

Community Narratives

