
Advertisement
- Saudi Arabia
- /
- Hospitality
- /
- SASE:4170
Tourism Enterprises (TADAWUL:4170) adds ر.س104m to market cap in the past 7 days, though investors from three years ago are still down 18%

Tourism Enterprises Co. (TADAWUL:4170) shareholders should be happy to see the share price up 27% in the last month. But that doesn't help the fact that the three year return is less impressive. In fact, the share price is down 87% in the last three years, falling well short of the market return. While a drop like that is definitely a body blow, money isn't as important as health and happiness.
While the last three years has been tough for Tourism Enterprises shareholders, this past week has shown signs of promise. So let's look at the longer term fundamentals and see if they've been the driver of the negative returns.
Check out our latest analysis for Tourism Enterprises
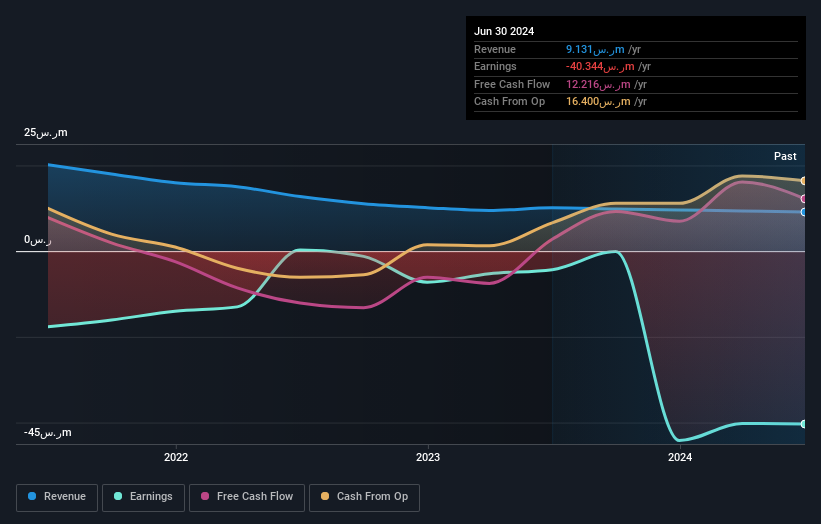
Given that Tourism Enterprises didn't make a profit in the last twelve months, we'll focus on revenue growth to form a quick view of its business development. When a company doesn't make profits, we'd generally hope to see good revenue growth. That's because fast revenue growth can be easily extrapolated to forecast profits, often of considerable size.
Over the last three years, Tourism Enterprises' revenue dropped 28% per year. That's definitely a weaker result than most pre-profit companies report. The swift share price decline at an annual compound rate of 23%, reflects this weak fundamental performance. We prefer leave it to clowns to try to catch falling knives, like this stock. It's worth remembering that investors call buying a steeply falling share price 'catching a falling knife' because it is a dangerous pass time.
The company's revenue and earnings (over time) are depicted in the image below (click to see the exact numbers).
You can see how its balance sheet has strengthened (or weakened) over time in this free interactive graphic.
What About The Total Shareholder Return (TSR)?
We'd be remiss not to mention the difference between Tourism Enterprises' total shareholder return (TSR) and its share price return. Arguably the TSR is a more complete return calculation because it accounts for the value of dividends (as if they were reinvested), along with the hypothetical value of any discounted capital that have been offered to shareholders. We note that Tourism Enterprises' TSR, at -18% is higher than its share price return of -87%. When you consider it hasn't been paying a dividend, this data suggests shareholders have benefitted from a spin-off, or had the opportunity to acquire attractively priced shares in a discounted capital raising.
A Different Perspective
We're pleased to report that Tourism Enterprises shareholders have received a total shareholder return of 25% over one year. That gain is better than the annual TSR over five years, which is 24%. Therefore it seems like sentiment around the company has been positive lately. Someone with an optimistic perspective could view the recent improvement in TSR as indicating that the business itself is getting better with time. I find it very interesting to look at share price over the long term as a proxy for business performance. But to truly gain insight, we need to consider other information, too. Case in point: We've spotted 2 warning signs for Tourism Enterprises you should be aware of, and 1 of them can't be ignored.
We will like Tourism Enterprises better if we see some big insider buys. While we wait, check out this free list of undervalued stocks (mostly small caps) with considerable, recent, insider buying.
Please note, the market returns quoted in this article reflect the market weighted average returns of stocks that currently trade on Saudi exchanges.
Valuation is complex, but we're here to simplify it.
Discover if Tourism Enterprise Company (Shams) might be undervalued or overvalued with our detailed analysis, featuring fair value estimates, potential risks, dividends, insider trades, and its financial condition.
Access Free AnalysisHave feedback on this article? Concerned about the content? Get in touch with us directly. Alternatively, email editorial-team (at) simplywallst.com.
This article by Simply Wall St is general in nature. We provide commentary based on historical data and analyst forecasts only using an unbiased methodology and our articles are not intended to be financial advice. It does not constitute a recommendation to buy or sell any stock, and does not take account of your objectives, or your financial situation. We aim to bring you long-term focused analysis driven by fundamental data. Note that our analysis may not factor in the latest price-sensitive company announcements or qualitative material. Simply Wall St has no position in any stocks mentioned.
About SASE:4170
Tourism Enterprise Company (Shams)
Engages in managing of tourism projects in the Kingdom of Saudi Arabia.
Flawless balance sheet with acceptable track record.
Market Insights

Advertisement
Community Narratives
Pinterest will surge as advertising innovations ignite revenue growth
Fair Value US$42.63|27.1% undervalued
BR
Community Contributor
Brambles' Revenue Set to Climb 14% with Profit Margins Following
Fair Value AU$21.90|4.9% overvalued
RO
Community Contributor
Challenging Future for STG as Organic Sales Decline by 8.8%
Fair Value DKK 116.13|26.8% undervalued
KA
Community Contributor