- Saudi Arabia
- /
- Food and Staples Retail
- /
- SASE:4161
BinDawood Holding Company's (TADAWUL:4161) Intrinsic Value Is Potentially 48% Above Its Share Price


Key Insights
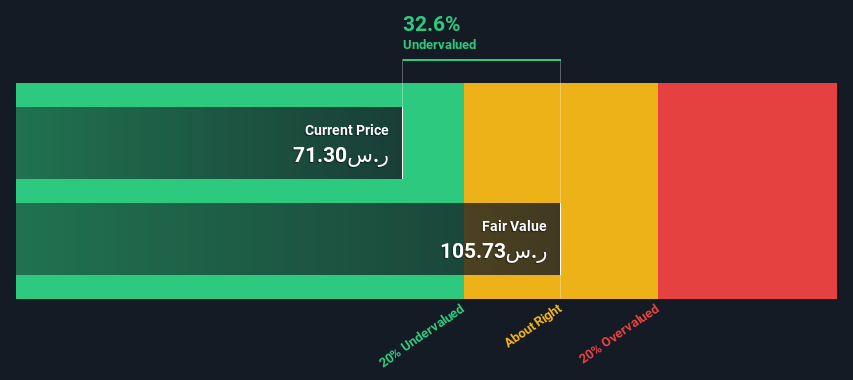
- BinDawood Holding's estimated fair value is ر.س106 based on 2 Stage Free Cash Flow to Equity
- Current share price of ر.س71.30 suggests BinDawood Holding is potentially 33% undervalued
- The ر.س63.94 analyst price target for 4161 is 40% less than our estimate of fair value
Today we'll do a simple run through of a valuation method used to estimate the attractiveness of BinDawood Holding Company (TADAWUL:4161) as an investment opportunity by taking the expected future cash flows and discounting them to their present value. The Discounted Cash Flow (DCF) model is the tool we will apply to do this. There's really not all that much to it, even though it might appear quite complex.
Remember though, that there are many ways to estimate a company's value, and a DCF is just one method. For those who are keen learners of equity analysis, the Simply Wall St analysis model here may be something of interest to you.
See our latest analysis for BinDawood Holding
Step By Step Through The Calculation
We are going to use a two-stage DCF model, which, as the name states, takes into account two stages of growth. The first stage is generally a higher growth period which levels off heading towards the terminal value, captured in the second 'steady growth' period. In the first stage we need to estimate the cash flows to the business over the next ten years. Where possible we use analyst estimates, but when these aren't available we extrapolate the previous free cash flow (FCF) from the last estimate or reported value. We assume companies with shrinking free cash flow will slow their rate of shrinkage, and that companies with growing free cash flow will see their growth rate slow, over this period. We do this to reflect that growth tends to slow more in the early years than it does in later years.
A DCF is all about the idea that a dollar in the future is less valuable than a dollar today, so we need to discount the sum of these future cash flows to arrive at a present value estimate:
10-year free cash flow (FCF) forecast
| 2023 | 2024 | 2025 | 2026 | 2027 | 2028 | 2029 | 2030 | 2031 | 2032 | |
| Levered FCF (SAR, Millions) | ر.س528.0m | ر.س713.0m | ر.س821.0m | ر.س900.7m | ر.س986.2m | ر.س1.08b | ر.س1.18b | ر.س1.29b | ر.س1.40b | ر.س1.53b |
| Growth Rate Estimate Source | Analyst x1 | Analyst x1 | Analyst x1 | Est @ 9.71% | Est @ 9.49% | Est @ 9.34% | Est @ 9.24% | Est @ 9.16% | Est @ 9.11% | Est @ 9.07% |
| Present Value (SAR, Millions) Discounted @ 15% | ر.س460 | ر.س542 | ر.س544 | ر.س520 | ر.س496 | ر.س473 | ر.س450 | ر.س429 | ر.س408 | ر.س388 |
("Est" = FCF growth rate estimated by Simply Wall St)
Present Value of 10-year Cash Flow (PVCF) = ر.س4.7b
After calculating the present value of future cash flows in the initial 10-year period, we need to calculate the Terminal Value, which accounts for all future cash flows beyond the first stage. The Gordon Growth formula is used to calculate Terminal Value at a future annual growth rate equal to the 5-year average of the 10-year government bond yield of 9.0%. We discount the terminal cash flows to today's value at a cost of equity of 15%.
Terminal Value (TV)= FCF2032 × (1 + g) ÷ (r – g) = ر.س1.5b× (1 + 9.0%) ÷ (15%– 9.0%) = ر.س29b
Present Value of Terminal Value (PVTV)= TV / (1 + r)10= ر.س29b÷ ( 1 + 15%)10= ر.س7.4b
The total value, or equity value, is then the sum of the present value of the future cash flows, which in this case is ر.س12b. In the final step we divide the equity value by the number of shares outstanding. Relative to the current share price of ر.س71.3, the company appears quite good value at a 33% discount to where the stock price trades currently. Remember though, that this is just an approximate valuation, and like any complex formula - garbage in, garbage out.
The Assumptions
Now the most important inputs to a discounted cash flow are the discount rate, and of course, the actual cash flows. If you don't agree with these result, have a go at the calculation yourself and play with the assumptions. The DCF also does not consider the possible cyclicality of an industry, or a company's future capital requirements, so it does not give a full picture of a company's potential performance. Given that we are looking at BinDawood Holding as potential shareholders, the cost of equity is used as the discount rate, rather than the cost of capital (or weighted average cost of capital, WACC) which accounts for debt. In this calculation we've used 15%, which is based on a levered beta of 0.800. Beta is a measure of a stock's volatility, compared to the market as a whole. We get our beta from the industry average beta of globally comparable companies, with an imposed limit between 0.8 and 2.0, which is a reasonable range for a stable business.
SWOT Analysis for BinDawood Holding
- Currently debt free.
- Earnings declined over the past year.
- Dividend is low compared to the top 25% of dividend payers in the Consumer Retailing market.
- Annual earnings are forecast to grow faster than the Saudi market.
- Trading below our estimate of fair value by more than 20%.
- Dividends are not covered by earnings.
- Revenue is forecast to grow slower than 20% per year.
Next Steps:
Although the valuation of a company is important, it is only one of many factors that you need to assess for a company. It's not possible to obtain a foolproof valuation with a DCF model. Instead the best use for a DCF model is to test certain assumptions and theories to see if they would lead to the company being undervalued or overvalued. For example, changes in the company's cost of equity or the risk free rate can significantly impact the valuation. What is the reason for the share price sitting below the intrinsic value? For BinDawood Holding, we've put together three fundamental aspects you should consider:
- Risks: You should be aware of the 4 warning signs for BinDawood Holding we've uncovered before considering an investment in the company.
- Future Earnings: How does 4161's growth rate compare to its peers and the wider market? Dig deeper into the analyst consensus number for the upcoming years by interacting with our free analyst growth expectation chart.
- Other High Quality Alternatives: Do you like a good all-rounder? Explore our interactive list of high quality stocks to get an idea of what else is out there you may be missing!
PS. Simply Wall St updates its DCF calculation for every Saudi stock every day, so if you want to find the intrinsic value of any other stock just search here.
If you're looking to trade BinDawood Holding, open an account with the lowest-cost platform trusted by professionals, Interactive Brokers.
With clients in over 200 countries and territories, and access to 160 markets, IBKR lets you trade stocks, options, futures, forex, bonds and funds from a single integrated account.
Enjoy no hidden fees, no account minimums, and FX conversion rates as low as 0.03%, far better than what most brokers offer.
Sponsored ContentValuation is complex, but we're here to simplify it.
Discover if BinDawood Holding might be undervalued or overvalued with our detailed analysis, featuring fair value estimates, potential risks, dividends, insider trades, and its financial condition.
Access Free AnalysisHave feedback on this article? Concerned about the content? Get in touch with us directly. Alternatively, email editorial-team (at) simplywallst.com.
This article by Simply Wall St is general in nature. We provide commentary based on historical data and analyst forecasts only using an unbiased methodology and our articles are not intended to be financial advice. It does not constitute a recommendation to buy or sell any stock, and does not take account of your objectives, or your financial situation. We aim to bring you long-term focused analysis driven by fundamental data. Note that our analysis may not factor in the latest price-sensitive company announcements or qualitative material. Simply Wall St has no position in any stocks mentioned.
About SASE:4161
BinDawood Holding
Engages in the retail trading of foodstuff and household items.
Adequate balance sheet with moderate growth potential.
Similar Companies
Market Insights

Community Narratives

