
Advertisement
- Saudi Arabia
- /
- Building
- /
- SASE:4144
Raoom trading's (TADAWUL:4144) Shareholders Have More To Worry About Than Only Soft Earnings

The subdued market reaction suggests that Raoom trading Company's (TADAWUL:4144) recent earnings didn't contain any surprises. However, we believe that investors should be aware of some underlying factors which may be of concern.
View our latest analysis for Raoom trading
A Closer Look At Raoom trading's Earnings
In high finance, the key ratio used to measure how well a company converts reported profits into free cash flow (FCF) is the accrual ratio (from cashflow). In plain english, this ratio subtracts FCF from net profit, and divides that number by the company's average operating assets over that period. The ratio shows us how much a company's profit exceeds its FCF.
Therefore, it's actually considered a good thing when a company has a negative accrual ratio, but a bad thing if its accrual ratio is positive. While having an accrual ratio above zero is of little concern, we do think it's worth noting when a company has a relatively high accrual ratio. Notably, there is some academic evidence that suggests that a high accrual ratio is a bad sign for near-term profits, generally speaking.
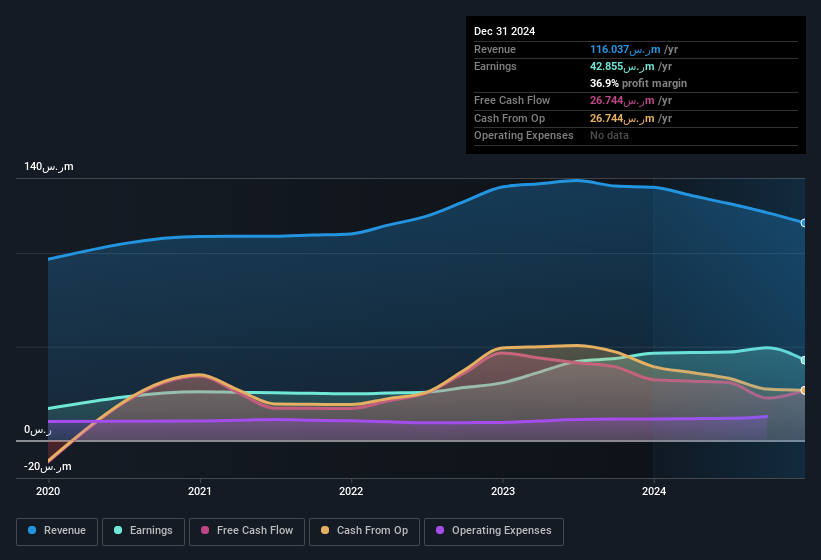
Raoom trading has an accrual ratio of 0.22 for the year to December 2024. Unfortunately, that means its free cash flow fell significantly short of its reported profits. Indeed, in the last twelve months it reported free cash flow of ر.س27m, which is significantly less than its profit of ر.س42.9m. Raoom trading's free cash flow actually declined over the last year, but it may bounce back next year, since free cash flow is often more volatile than accounting profits.
Note: we always recommend investors check balance sheet strength. Click here to be taken to our balance sheet analysis of Raoom trading.
Our Take On Raoom trading's Profit Performance
Raoom trading didn't convert much of its profit to free cash flow in the last year, which some investors may consider rather suboptimal. Therefore, it seems possible to us that Raoom trading's true underlying earnings power is actually less than its statutory profit. But on the bright side, its earnings per share have grown at an extremely impressive rate over the last three years. At the end of the day, it's essential to consider more than just the factors above, if you want to understand the company properly. If you'd like to know more about Raoom trading as a business, it's important to be aware of any risks it's facing. At Simply Wall St, we found 1 warning sign for Raoom trading and we think they deserve your attention.
Today we've zoomed in on a single data point to better understand the nature of Raoom trading's profit. But there are plenty of other ways to inform your opinion of a company. For example, many people consider a high return on equity as an indication of favorable business economics, while others like to 'follow the money' and search out stocks that insiders are buying. So you may wish to see this free collection of companies boasting high return on equity, or this list of stocks with high insider ownership.
New: AI Stock Screener & Alerts
Our new AI Stock Screener scans the market every day to uncover opportunities.
• Dividend Powerhouses (3%+ Yield)
• Undervalued Small Caps with Insider Buying
• High growth Tech and AI Companies
Or build your own from over 50 metrics.
Have feedback on this article? Concerned about the content? Get in touch with us directly. Alternatively, email editorial-team (at) simplywallst.com.
This article by Simply Wall St is general in nature. We provide commentary based on historical data and analyst forecasts only using an unbiased methodology and our articles are not intended to be financial advice. It does not constitute a recommendation to buy or sell any stock, and does not take account of your objectives, or your financial situation. We aim to bring you long-term focused analysis driven by fundamental data. Note that our analysis may not factor in the latest price-sensitive company announcements or qualitative material. Simply Wall St has no position in any stocks mentioned.
About SASE:4144
Raoom trading
Engages in the manufacture, trade, and installation of glass, mirrors, and aluminum decorations in the Kingdom of Saudi Arabia.
Flawless balance sheet low.
Market Insights

Advertisement
Community Narratives
Pinterest will surge as advertising innovations ignite revenue growth
Fair Value US$42.63|27.0% undervalued
BR
Community Contributor
Brambles' Revenue Set to Climb 14% with Profit Margins Following
Fair Value AU$21.90|5.9% overvalued
RO
Community Contributor
Challenging Future for STG as Organic Sales Decline by 8.8%
Fair Value DKK 116.13|26.8% undervalued
KA
Community Contributor