- Saudi Arabia
- /
- Building
- /
- SASE:4141
Returns At Al-Omran Industrial Trading (TADAWUL:4141) Appear To Be Weighed Down


If you're not sure where to start when looking for the next multi-bagger, there are a few key trends you should keep an eye out for. Amongst other things, we'll want to see two things; firstly, a growing return on capital employed (ROCE) and secondly, an expansion in the company's amount of capital employed. Put simply, these types of businesses are compounding machines, meaning they are continually reinvesting their earnings at ever-higher rates of return. Having said that, from a first glance at Al-Omran Industrial Trading (TADAWUL:4141) we aren't jumping out of our chairs at how returns are trending, but let's have a deeper look.
Understanding Return On Capital Employed (ROCE)
Just to clarify if you're unsure, ROCE is a metric for evaluating how much pre-tax income (in percentage terms) a company earns on the capital invested in its business. To calculate this metric for Al-Omran Industrial Trading, this is the formula:
Return on Capital Employed = Earnings Before Interest and Tax (EBIT) ÷ (Total Assets - Current Liabilities)
0.08 = ر.س9.3m ÷ (ر.س186m - ر.س69m) (Based on the trailing twelve months to September 2020).
Thus, Al-Omran Industrial Trading has an ROCE of 8.0%. In absolute terms, that's a low return but it's around the Building industry average of 9.0%.
View our latest analysis for Al-Omran Industrial Trading
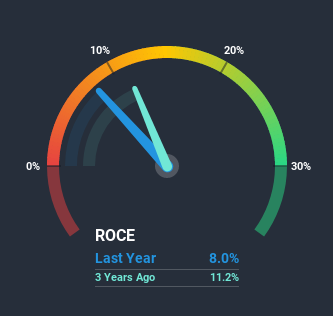
Historical performance is a great place to start when researching a stock so above you can see the gauge for Al-Omran Industrial Trading's ROCE against it's prior returns. If you're interested in investigating Al-Omran Industrial Trading's past further, check out this free graph of past earnings, revenue and cash flow.
What The Trend Of ROCE Can Tell Us
Things have been pretty stable at Al-Omran Industrial Trading, with its capital employed and returns on that capital staying somewhat the same for the last five years. It's not uncommon to see this when looking at a mature and stable business that isn't re-investing its earnings because it has likely passed that phase of the business cycle. With that in mind, unless investment picks up again in the future, we wouldn't expect Al-Omran Industrial Trading to be a multi-bagger going forward.
On another note, while the change in ROCE trend might not scream for attention, it's interesting that the current liabilities have actually gone up over the last five years. This is intriguing because if current liabilities hadn't increased to 37% of total assets, this reported ROCE would probably be less than8.0% because total capital employed would be higher.The 8.0% ROCE could be even lower if current liabilities weren't 37% of total assets, because the the formula would show a larger base of total capital employed. So while current liabilities isn't high right now, keep an eye out in case it increases further, because this can introduce some elements of risk.
The Bottom Line
In a nutshell, Al-Omran Industrial Trading has been trudging along with the same returns from the same amount of capital over the last five years. Yet to long term shareholders the stock has gifted them an incredible 553% return in the last three years, so the market appears to be rosy about its future. Ultimately, if the underlying trends persist, we wouldn't hold our breath on it being a multi-bagger going forward.
Al-Omran Industrial Trading does have some risks though, and we've spotted 2 warning signs for Al-Omran Industrial Trading that you might be interested in.
For those who like to invest in solid companies, check out this free list of companies with solid balance sheets and high returns on equity.
When trading Al-Omran Industrial Trading or any other investment, use the platform considered by many to be the Professional's Gateway to the Worlds Market, Interactive Brokers. You get the lowest-cost* trading on stocks, options, futures, forex, bonds and funds worldwide from a single integrated account. Promoted
New: Manage All Your Stock Portfolios in One Place
We've created the ultimate portfolio companion for stock investors, and it's free.
• Connect an unlimited number of Portfolios and see your total in one currency
• Be alerted to new Warning Signs or Risks via email or mobile
• Track the Fair Value of your stocks
This article by Simply Wall St is general in nature. It does not constitute a recommendation to buy or sell any stock, and does not take account of your objectives, or your financial situation. We aim to bring you long-term focused analysis driven by fundamental data. Note that our analysis may not factor in the latest price-sensitive company announcements or qualitative material. Simply Wall St has no position in any stocks mentioned.
*Interactive Brokers Rated Lowest Cost Broker by StockBrokers.com Annual Online Review 2020
Have feedback on this article? Concerned about the content? Get in touch with us directly. Alternatively, email editorial-team (at) simplywallst.com.
About SASE:4141
Al-Omran Industrial Trading
Manufactures, imports, sells, wholesales, retails, and exports household and electronic devices and products.
Excellent balance sheet minimal.
Market Insights

Community Narratives
