- Saudi Arabia
- /
- Building
- /
- SASE:4141
Al-Omran Industrial Trading Co.'s (TADAWUL:4141) Financials Are Too Obscure To Link With Current Share Price Momentum: What's In Store For the Stock?


Al-Omran Industrial Trading's (TADAWUL:4141) stock is up by a considerable 36% over the past three months. However, we decided to pay attention to the company's fundamentals which don't appear to give a clear sign about the company's financial health. Particularly, we will be paying attention to Al-Omran Industrial Trading's ROE today.
ROE or return on equity is a useful tool to assess how effectively a company can generate returns on the investment it received from its shareholders. In short, ROE shows the profit each dollar generates with respect to its shareholder investments.
See our latest analysis for Al-Omran Industrial Trading
How Do You Calculate Return On Equity?
The formula for return on equity is:
Return on Equity = Net Profit (from continuing operations) ÷ Shareholders' Equity
So, based on the above formula, the ROE for Al-Omran Industrial Trading is:
2.2% = ر.س2.5m ÷ ر.س111m (Based on the trailing twelve months to September 2020).
The 'return' is the income the business earned over the last year. That means that for every SAR1 worth of shareholders' equity, the company generated SAR0.02 in profit.
Why Is ROE Important For Earnings Growth?
Thus far, we have learned that ROE measures how efficiently a company is generating its profits. We now need to evaluate how much profit the company reinvests or "retains" for future growth which then gives us an idea about the growth potential of the company. Assuming everything else remains unchanged, the higher the ROE and profit retention, the higher the growth rate of a company compared to companies that don't necessarily bear these characteristics.
Al-Omran Industrial Trading's Earnings Growth And 2.2% ROE
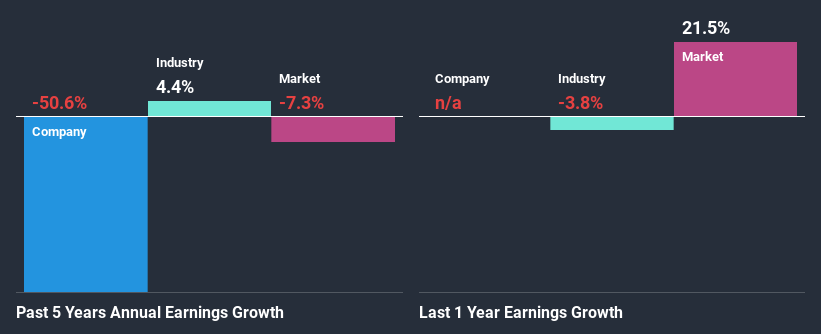
It is quite clear that Al-Omran Industrial Trading's ROE is rather low. Even when compared to the industry average of 7.7%, the ROE figure is pretty disappointing. For this reason, Al-Omran Industrial Trading's five year net income decline of 51% is not surprising given its lower ROE. We believe that there also might be other aspects that are negatively influencing the company's earnings prospects. Such as - low earnings retention or poor allocation of capital.
So, as a next step, we compared Al-Omran Industrial Trading's performance against the industry and were disappointed to discover that while the company has been shrinking its earnings, the industry has been growing its earnings at a rate of 5.9% in the same period.
The basis for attaching value to a company is, to a great extent, tied to its earnings growth. What investors need to determine next is if the expected earnings growth, or the lack of it, is already built into the share price. Doing so will help them establish if the stock's future looks promising or ominous. If you're wondering about Al-Omran Industrial Trading's's valuation, check out this gauge of its price-to-earnings ratio, as compared to its industry.
Is Al-Omran Industrial Trading Making Efficient Use Of Its Profits?
Summary
Overall, we have mixed feelings about Al-Omran Industrial Trading. While the company does have a high rate of profit retention, its low rate of return is probably hampering its earnings growth. Wrapping up, we would proceed with caution with this company and one way of doing that would be to look at the risk profile of the business. Our risks dashboard would have the 3 risks we have identified for Al-Omran Industrial Trading.
If you decide to trade Al-Omran Industrial Trading, use the lowest-cost* platform that is rated #1 Overall by Barron’s, Interactive Brokers. Trade stocks, options, futures, forex, bonds and funds on 135 markets, all from a single integrated account. Promoted
New: Manage All Your Stock Portfolios in One Place
We've created the ultimate portfolio companion for stock investors, and it's free.
• Connect an unlimited number of Portfolios and see your total in one currency
• Be alerted to new Warning Signs or Risks via email or mobile
• Track the Fair Value of your stocks
This article by Simply Wall St is general in nature. It does not constitute a recommendation to buy or sell any stock, and does not take account of your objectives, or your financial situation. We aim to bring you long-term focused analysis driven by fundamental data. Note that our analysis may not factor in the latest price-sensitive company announcements or qualitative material. Simply Wall St has no position in any stocks mentioned.
*Interactive Brokers Rated Lowest Cost Broker by StockBrokers.com Annual Online Review 2020
Have feedback on this article? Concerned about the content? Get in touch with us directly. Alternatively, email editorial-team@simplywallst.com.
About SASE:4141
Al-Omran Industrial Trading
Manufactures, imports, sells, wholesales, retails, and exports household and electronic devices and products.
Excellent balance sheet and overvalued.
Market Insights

Community Narratives

