- Russia
- /
- Metals and Mining
- /
- MISX:MAGN
Public Joint Stock Company Magnitogorsk Iron & Steel Works' (MCX:MAGN) Intrinsic Value Is Potentially 35% Above Its Share Price


In this article we are going to estimate the intrinsic value of Public Joint Stock Company Magnitogorsk Iron & Steel Works (MCX:MAGN) by taking the expected future cash flows and discounting them to their present value. Our analysis will employ the Discounted Cash Flow (DCF) model. Before you think you won't be able to understand it, just read on! It's actually much less complex than you'd imagine.
Companies can be valued in a lot of ways, so we would point out that a DCF is not perfect for every situation. Anyone interested in learning a bit more about intrinsic value should have a read of the Simply Wall St analysis model.
View our latest analysis for Magnitogorsk Iron & Steel Works
Step by step through the calculation
We use what is known as a 2-stage model, which simply means we have two different periods of growth rates for the company's cash flows. Generally the first stage is higher growth, and the second stage is a lower growth phase. In the first stage we need to estimate the cash flows to the business over the next ten years. Where possible we use analyst estimates, but when these aren't available we extrapolate the previous free cash flow (FCF) from the last estimate or reported value. We assume companies with shrinking free cash flow will slow their rate of shrinkage, and that companies with growing free cash flow will see their growth rate slow, over this period. We do this to reflect that growth tends to slow more in the early years than it does in later years.
Generally we assume that a dollar today is more valuable than a dollar in the future, so we discount the value of these future cash flows to their estimated value in today's dollars:
10-year free cash flow (FCF) forecast
| 2022 | 2023 | 2024 | 2025 | 2026 | 2027 | 2028 | 2029 | 2030 | 2031 | |
| Levered FCF ($, Millions) | US$2.09b | US$1.53b | US$1.57b | US$1.40b | US$1.33b | US$1.31b | US$1.32b | US$1.36b | US$1.42b | US$1.49b |
| Growth Rate Estimate Source | Analyst x2 | Analyst x2 | Analyst x1 | Est @ -10.85% | Est @ -5.4% | Est @ -1.58% | Est @ 1.09% | Est @ 2.96% | Est @ 4.27% | Est @ 5.18% |
| Present Value ($, Millions) Discounted @ 14% | US$1.8k | US$1.2k | US$1.1k | US$828 | US$687 | US$592 | US$525 | US$474 | US$433 | US$399 |
("Est" = FCF growth rate estimated by Simply Wall St)
Present Value of 10-year Cash Flow (PVCF) = US$8.0b
The second stage is also known as Terminal Value, this is the business's cash flow after the first stage. For a number of reasons a very conservative growth rate is used that cannot exceed that of a country's GDP growth. In this case we have used the 5-year average of the 10-year government bond yield (7.3%) to estimate future growth. In the same way as with the 10-year 'growth' period, we discount future cash flows to today's value, using a cost of equity of 14%.
Terminal Value (TV)= FCF2031 × (1 + g) ÷ (r – g) = US$1.5b× (1 + 7.3%) ÷ (14%– 7.3%) = US$24b
Present Value of Terminal Value (PVTV)= TV / (1 + r)10= US$24b÷ ( 1 + 14%)10= US$6.3b
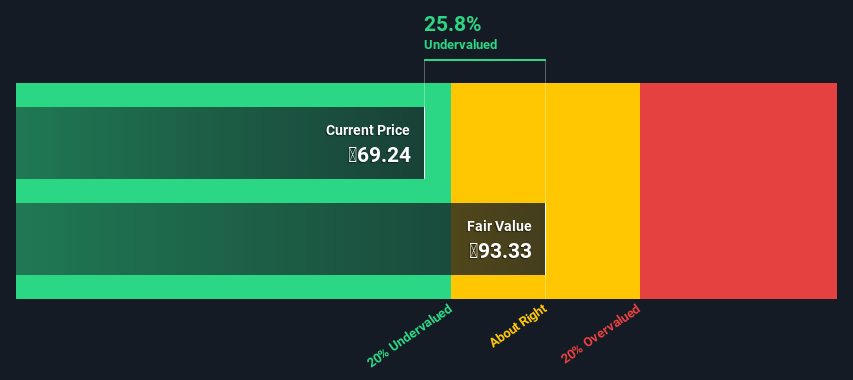
The total value, or equity value, is then the sum of the present value of the future cash flows, which in this case is US$14b. To get the intrinsic value per share, we divide this by the total number of shares outstanding. Relative to the current share price of ₽69.2, the company appears a touch undervalued at a 26% discount to where the stock price trades currently. Remember though, that this is just an approximate valuation, and like any complex formula - garbage in, garbage out.
The assumptions
Now the most important inputs to a discounted cash flow are the discount rate, and of course, the actual cash flows. If you don't agree with these result, have a go at the calculation yourself and play with the assumptions. The DCF also does not consider the possible cyclicality of an industry, or a company's future capital requirements, so it does not give a full picture of a company's potential performance. Given that we are looking at Magnitogorsk Iron & Steel Works as potential shareholders, the cost of equity is used as the discount rate, rather than the cost of capital (or weighted average cost of capital, WACC) which accounts for debt. In this calculation we've used 14%, which is based on a levered beta of 1.086. Beta is a measure of a stock's volatility, compared to the market as a whole. We get our beta from the industry average beta of globally comparable companies, with an imposed limit between 0.8 and 2.0, which is a reasonable range for a stable business.
Looking Ahead:
Whilst important, the DCF calculation is only one of many factors that you need to assess for a company. It's not possible to obtain a foolproof valuation with a DCF model. Rather it should be seen as a guide to "what assumptions need to be true for this stock to be under/overvalued?" For example, changes in the company's cost of equity or the risk free rate can significantly impact the valuation. Why is the intrinsic value higher than the current share price? For Magnitogorsk Iron & Steel Works, there are three fundamental elements you should assess:
- Risks: For example, we've discovered 3 warning signs for Magnitogorsk Iron & Steel Works (1 is significant!) that you should be aware of before investing here.
- Future Earnings: How does MAGN's growth rate compare to its peers and the wider market? Dig deeper into the analyst consensus number for the upcoming years by interacting with our free analyst growth expectation chart.
- Other High Quality Alternatives: Do you like a good all-rounder? Explore our interactive list of high quality stocks to get an idea of what else is out there you may be missing!
PS. The Simply Wall St app conducts a discounted cash flow valuation for every stock on the MISX every day. If you want to find the calculation for other stocks just search here.
If you're looking to trade Magnitogorsk Iron & Steel Works, open an account with the lowest-cost platform trusted by professionals, Interactive Brokers.
With clients in over 200 countries and territories, and access to 160 markets, IBKR lets you trade stocks, options, futures, forex, bonds and funds from a single integrated account.
Enjoy no hidden fees, no account minimums, and FX conversion rates as low as 0.03%, far better than what most brokers offer.
Sponsored ContentNew: Manage All Your Stock Portfolios in One Place
We've created the ultimate portfolio companion for stock investors, and it's free.
• Connect an unlimited number of Portfolios and see your total in one currency
• Be alerted to new Warning Signs or Risks via email or mobile
• Track the Fair Value of your stocks
This article by Simply Wall St is general in nature. We provide commentary based on historical data and analyst forecasts only using an unbiased methodology and our articles are not intended to be financial advice. It does not constitute a recommendation to buy or sell any stock, and does not take account of your objectives, or your financial situation. We aim to bring you long-term focused analysis driven by fundamental data. Note that our analysis may not factor in the latest price-sensitive company announcements or qualitative material. Simply Wall St has no position in any stocks mentioned.
Have feedback on this article? Concerned about the content? Get in touch with us directly. Alternatively, email editorial-team (at) simplywallst.com.
About MISX:MAGN
Magnitogorsk Iron & Steel Works
Public Joint Stock Company Magnitogorsk Iron & Steel Works, together with its subsidiaries, produces and sells ferrous metal products in Russia and the CIS countries, the Middle East, South Africa, Asia, Europe, North America, and Africa.
Solid track record with excellent balance sheet and pays a dividend.

