
Advertisement
- Romania
- /
- Hospitality
- /
- BVB:EFO
Turism Hoteluri Restaurante Marea Neagra (BVB:EFO) jumps 35% this week, though earnings growth is still tracking behind five-year shareholder returns

For many, the main point of investing in the stock market is to achieve spectacular returns. And highest quality companies can see their share prices grow by huge amounts. Don't believe it? Then look at the Turism, Hoteluri, Restaurante Marea Neagra S.A. (BVB:EFO) share price. It's 382% higher than it was five years ago. This just goes to show the value creation that some businesses can achieve. Also pleasing for shareholders was the 38% gain in the last three months.
On the back of a solid 7-day performance, let's check what role the company's fundamentals have played in driving long term shareholder returns.
View our latest analysis for Turism Hoteluri Restaurante Marea Neagra
In his essay The Superinvestors of Graham-and-Doddsville Warren Buffett described how share prices do not always rationally reflect the value of a business. By comparing earnings per share (EPS) and share price changes over time, we can get a feel for how investor attitudes to a company have morphed over time.
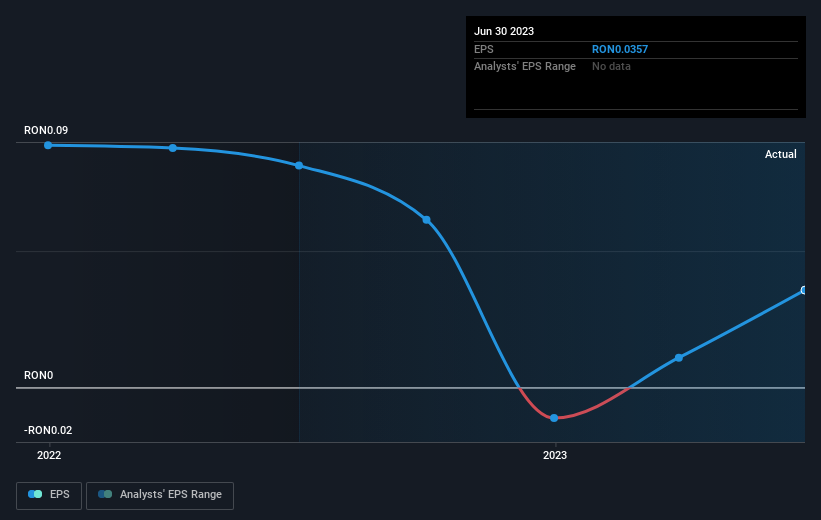
During five years of share price growth, Turism Hoteluri Restaurante Marea Neagra achieved compound earnings per share (EPS) growth of 66% per year. This EPS growth is higher than the 37% average annual increase in the share price. Therefore, it seems the market has become relatively pessimistic about the company. This cautious sentiment is reflected in its (fairly low) P/E ratio of 11.49.
You can see how EPS has changed over time in the image below (click on the chart to see the exact values).
This free interactive report on Turism Hoteluri Restaurante Marea Neagra's earnings, revenue and cash flow is a great place to start, if you want to investigate the stock further.
What About Dividends?
When looking at investment returns, it is important to consider the difference between total shareholder return (TSR) and share price return. Whereas the share price return only reflects the change in the share price, the TSR includes the value of dividends (assuming they were reinvested) and the benefit of any discounted capital raising or spin-off. Arguably, the TSR gives a more comprehensive picture of the return generated by a stock. We note that for Turism Hoteluri Restaurante Marea Neagra the TSR over the last 5 years was 615%, which is better than the share price return mentioned above. And there's no prize for guessing that the dividend payments largely explain the divergence!
A Different Perspective
It's good to see that Turism Hoteluri Restaurante Marea Neagra has rewarded shareholders with a total shareholder return of 132% in the last twelve months. And that does include the dividend. Since the one-year TSR is better than the five-year TSR (the latter coming in at 48% per year), it would seem that the stock's performance has improved in recent times. Given the share price momentum remains strong, it might be worth taking a closer look at the stock, lest you miss an opportunity. I find it very interesting to look at share price over the long term as a proxy for business performance. But to truly gain insight, we need to consider other information, too. Even so, be aware that Turism Hoteluri Restaurante Marea Neagra is showing 5 warning signs in our investment analysis , and 1 of those makes us a bit uncomfortable...
If you are like me, then you will not want to miss this free list of growing companies that insiders are buying.
Please note, the market returns quoted in this article reflect the market weighted average returns of stocks that currently trade on Romanian exchanges.
Valuation is complex, but we're here to simplify it.
Discover if Turism Hoteluri Restaurante Marea Neagra might be undervalued or overvalued with our detailed analysis, featuring fair value estimates, potential risks, dividends, insider trades, and its financial condition.
Access Free AnalysisHave feedback on this article? Concerned about the content? Get in touch with us directly. Alternatively, email editorial-team (at) simplywallst.com.
This article by Simply Wall St is general in nature. We provide commentary based on historical data and analyst forecasts only using an unbiased methodology and our articles are not intended to be financial advice. It does not constitute a recommendation to buy or sell any stock, and does not take account of your objectives, or your financial situation. We aim to bring you long-term focused analysis driven by fundamental data. Note that our analysis may not factor in the latest price-sensitive company announcements or qualitative material. Simply Wall St has no position in any stocks mentioned.
About BVB:EFO
Turism Hoteluri Restaurante Marea Neagra
Turism, Hoteluri, Restaurante Marea Neagra S.A.
Medium-low with adequate balance sheet.
Market Insights

Advertisement
Community Narratives
Groundbreaking therapies that could change the treatment landscape for PTSD, fibromyalgia, MS & Alzheimer’s
Fair Value US$6.20|86.9% undervalued
CM
Community Contributor
DigitalOcean Will Grow 14% by Embracing AI with Paperspace Acquisition
Fair Value US$50.00|41.7% undervalued
NE
Community Contributor
Viant Technology: A Rising AdTech Challenger in the AI-Powered CTV Market
Fair Value US$38.61|63.2% undervalued
BL
Community Contributor
Volvo will Accelerate Forward into Electric and Autonomous Leadership in Five Years
Fair Value SEK 438.80|39.7% undervalued
UN
Community Contributor