- Romania
- /
- Food and Staples Retail
- /
- BVB:RPH
Some Investors May Be Worried About S.C. Ropharma's (BVB:RPH) Returns On Capital


If you're looking for a multi-bagger, there's a few things to keep an eye out for. Firstly, we'd want to identify a growing return on capital employed (ROCE) and then alongside that, an ever-increasing base of capital employed. This shows us that it's a compounding machine, able to continually reinvest its earnings back into the business and generate higher returns. Although, when we looked at S.C. Ropharma (BVB:RPH), it didn't seem to tick all of these boxes.
Understanding Return On Capital Employed (ROCE)
If you haven't worked with ROCE before, it measures the 'return' (pre-tax profit) a company generates from capital employed in its business. Analysts use this formula to calculate it for S.C. Ropharma:
Return on Capital Employed = Earnings Before Interest and Tax (EBIT) ÷ (Total Assets - Current Liabilities)
0.054 = RON15m ÷ (RON621m - RON337m) (Based on the trailing twelve months to June 2021).
Therefore, S.C. Ropharma has an ROCE of 5.4%. In absolute terms, that's a low return and it also under-performs the Consumer Retailing industry average of 10%.
View our latest analysis for S.C. Ropharma
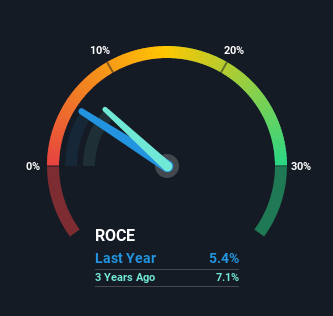
Historical performance is a great place to start when researching a stock so above you can see the gauge for S.C. Ropharma's ROCE against it's prior returns. If you'd like to look at how S.C. Ropharma has performed in the past in other metrics, you can view this free graph of past earnings, revenue and cash flow.
What Does the ROCE Trend For S.C. Ropharma Tell Us?
On the surface, the trend of ROCE at S.C. Ropharma doesn't inspire confidence. Over the last five years, returns on capital have decreased to 5.4% from 7.5% five years ago. However it looks like S.C. Ropharma might be reinvesting for long term growth because while capital employed has increased, the company's sales haven't changed much in the last 12 months. It may take some time before the company starts to see any change in earnings from these investments.
On a separate but related note, it's important to know that S.C. Ropharma has a current liabilities to total assets ratio of 54%, which we'd consider pretty high. This effectively means that suppliers (or short-term creditors) are funding a large portion of the business, so just be aware that this can introduce some elements of risk. While it's not necessarily a bad thing, it can be beneficial if this ratio is lower.
Our Take On S.C. Ropharma's ROCE
To conclude, we've found that S.C. Ropharma is reinvesting in the business, but returns have been falling. And investors appear hesitant that the trends will pick up because the stock has fallen 35% in the last five years. In any case, the stock doesn't have these traits of a multi-bagger discussed above, so if that's what you're looking for, we think you'd have more luck elsewhere.
If you'd like to know more about S.C. Ropharma, we've spotted 3 warning signs, and 1 of them makes us a bit uncomfortable.
If you want to search for solid companies with great earnings, check out this free list of companies with good balance sheets and impressive returns on equity.
If you're looking to trade S.C. Ropharma, open an account with the lowest-cost platform trusted by professionals, Interactive Brokers.
With clients in over 200 countries and territories, and access to 160 markets, IBKR lets you trade stocks, options, futures, forex, bonds and funds from a single integrated account.
Enjoy no hidden fees, no account minimums, and FX conversion rates as low as 0.03%, far better than what most brokers offer.
Sponsored ContentNew: Manage All Your Stock Portfolios in One Place
We've created the ultimate portfolio companion for stock investors, and it's free.
• Connect an unlimited number of Portfolios and see your total in one currency
• Be alerted to new Warning Signs or Risks via email or mobile
• Track the Fair Value of your stocks
Have feedback on this article? Concerned about the content? Get in touch with us directly. Alternatively, email editorial-team (at) simplywallst.com.
This article by Simply Wall St is general in nature. We provide commentary based on historical data and analyst forecasts only using an unbiased methodology and our articles are not intended to be financial advice. It does not constitute a recommendation to buy or sell any stock, and does not take account of your objectives, or your financial situation. We aim to bring you long-term focused analysis driven by fundamental data. Note that our analysis may not factor in the latest price-sensitive company announcements or qualitative material. Simply Wall St has no position in any stocks mentioned.
About BVB:RPH
Flawless balance sheet slight.
Similar Companies
Market Insights

Community Narratives

