
Advertisement
- Qatar
- /
- Real Estate
- /
- DSM:NLCS
Alijarah Holding (Q.P.S.C.) (DSM:NLCS) sheds ر.ق47m, company earnings and investor returns have been trending downwards for past three years

As an investor its worth striving to ensure your overall portfolio beats the market average. But its virtually certain that sometimes you will buy stocks that fall short of the market average returns. We regret to report that long term Alijarah Holding (Q.P.S.C.) (DSM:NLCS) shareholders have had that experience, with the share price dropping 48% in three years, versus a market decline of about 2.5%. The more recent news is of little comfort, with the share price down 29% in a year. Shareholders have had an even rougher run lately, with the share price down 20% in the last 90 days.
Given the past week has been tough on shareholders, let's investigate the fundamentals and see what we can learn.
Check out our latest analysis for Alijarah Holding (Q.P.S.C.)
To paraphrase Benjamin Graham: Over the short term the market is a voting machine, but over the long term it's a weighing machine. By comparing earnings per share (EPS) and share price changes over time, we can get a feel for how investor attitudes to a company have morphed over time.
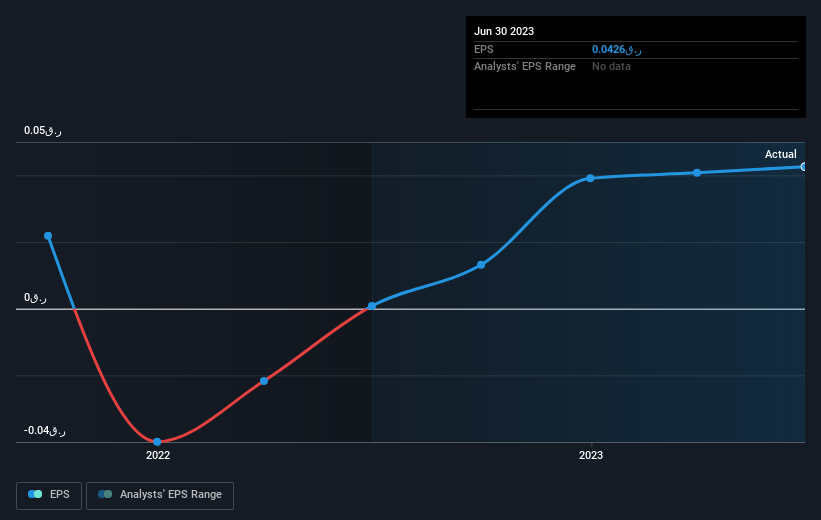
During the three years that the share price fell, Alijarah Holding (Q.P.S.C.)'s earnings per share (EPS) dropped by 20% each year. So do you think it's a coincidence that the share price has dropped 19% per year, a very similar rate to the EPS? We don't. So it seems that investor expectations of the company are staying pretty steady, despite the disappointment. It seems like the share price is reflecting the declining earnings per share.
The company's earnings per share (over time) is depicted in the image below (click to see the exact numbers).
Dive deeper into Alijarah Holding (Q.P.S.C.)'s key metrics by checking this interactive graph of Alijarah Holding (Q.P.S.C.)'s earnings, revenue and cash flow.
What About Dividends?
As well as measuring the share price return, investors should also consider the total shareholder return (TSR). Whereas the share price return only reflects the change in the share price, the TSR includes the value of dividends (assuming they were reinvested) and the benefit of any discounted capital raising or spin-off. So for companies that pay a generous dividend, the TSR is often a lot higher than the share price return. As it happens, Alijarah Holding (Q.P.S.C.)'s TSR for the last 3 years was -44%, which exceeds the share price return mentioned earlier. This is largely a result of its dividend payments!
A Different Perspective
We regret to report that Alijarah Holding (Q.P.S.C.) shareholders are down 26% for the year (even including dividends). Unfortunately, that's worse than the broader market decline of 17%. However, it could simply be that the share price has been impacted by broader market jitters. It might be worth keeping an eye on the fundamentals, in case there's a good opportunity. Unfortunately, last year's performance may indicate unresolved challenges, given that it was worse than the annualised loss of 1.0% over the last half decade. Generally speaking long term share price weakness can be a bad sign, though contrarian investors might want to research the stock in hope of a turnaround. While it is well worth considering the different impacts that market conditions can have on the share price, there are other factors that are even more important. For instance, we've identified 4 warning signs for Alijarah Holding (Q.P.S.C.) (1 shouldn't be ignored) that you should be aware of.
If you are like me, then you will not want to miss this free list of growing companies that insiders are buying.
Please note, the market returns quoted in this article reflect the market weighted average returns of stocks that currently trade on Qatari exchanges.
New: Manage All Your Stock Portfolios in One Place
We've created the ultimate portfolio companion for stock investors, and it's free.
• Connect an unlimited number of Portfolios and see your total in one currency
• Be alerted to new Warning Signs or Risks via email or mobile
• Track the Fair Value of your stocks
Have feedback on this article? Concerned about the content? Get in touch with us directly. Alternatively, email editorial-team (at) simplywallst.com.
This article by Simply Wall St is general in nature. We provide commentary based on historical data and analyst forecasts only using an unbiased methodology and our articles are not intended to be financial advice. It does not constitute a recommendation to buy or sell any stock, and does not take account of your objectives, or your financial situation. We aim to bring you long-term focused analysis driven by fundamental data. Note that our analysis may not factor in the latest price-sensitive company announcements or qualitative material. Simply Wall St has no position in any stocks mentioned.
About DSM:NLCS
Adequate balance sheet with acceptable track record.
Market Insights


Advertisement
Community Narratives
For the Emperor: Why Games Workshop Could Be a Star Investment
Fair Value UK£160.00|0.1% overvalued
RO
Community Contributor
Securitas will boost margins with AI and tech-driven services
Fair Value SEK 260.91|44.5% undervalued
UN
Community Contributor
A Leader in EV Charging with Growth Potential
Fair Value €27.00|20.9% undervalued
TI
Community Contributor