
Advertisement
- Portugal
- /
- Paper and Forestry Products
- /
- ENXTLS:SEM
Semapa - Sociedade de Investimento e Gestão SGPS (ELI:SEM) stock performs better than its underlying earnings growth over last three years

One simple way to benefit from the stock market is to buy an index fund. But many of us dare to dream of bigger returns, and build a portfolio ourselves. Just take a look at Semapa - Sociedade de Investimento e Gestão, SGPS, S.A. (ELI:SEM), which is up 36%, over three years, soundly beating the market return of 13% (not including dividends). However, more recent returns haven't been as impressive as that, with the stock returning just 25% in the last year , including dividends .
Since the stock has added €48m to its market cap in the past week alone, let's see if underlying performance has been driving long-term returns.
See our latest analysis for Semapa - Sociedade de Investimento e Gestão SGPS
There is no denying that markets are sometimes efficient, but prices do not always reflect underlying business performance. One imperfect but simple way to consider how the market perception of a company has shifted is to compare the change in the earnings per share (EPS) with the share price movement.
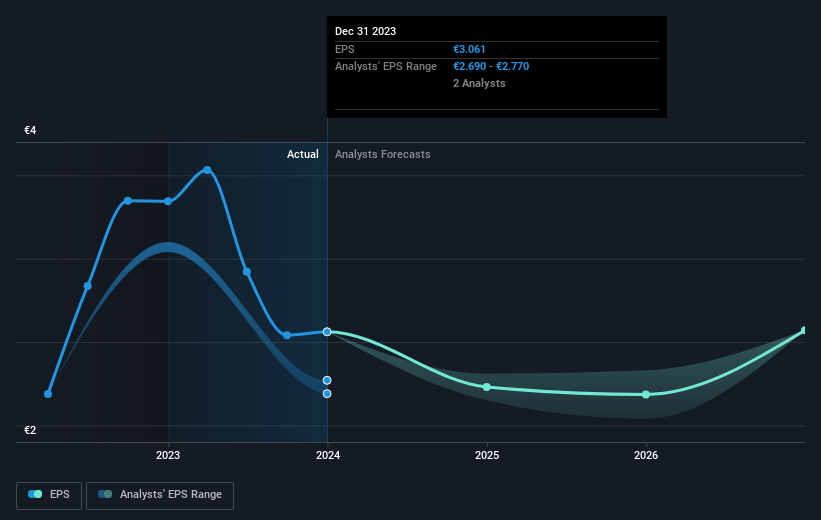
Semapa - Sociedade de Investimento e Gestão SGPS was able to grow its EPS at 32% per year over three years, sending the share price higher. This EPS growth is higher than the 11% average annual increase in the share price. So one could reasonably conclude that the market has cooled on the stock. We'd venture the lowish P/E ratio of 5.29 also reflects the negative sentiment around the stock.
The company's earnings per share (over time) is depicted in the image below (click to see the exact numbers).
We know that Semapa - Sociedade de Investimento e Gestão SGPS has improved its bottom line over the last three years, but what does the future have in store? You can see how its balance sheet has strengthened (or weakened) over time in this free interactive graphic.
What About Dividends?
When looking at investment returns, it is important to consider the difference between total shareholder return (TSR) and share price return. The TSR is a return calculation that accounts for the value of cash dividends (assuming that any dividend received was reinvested) and the calculated value of any discounted capital raisings and spin-offs. Arguably, the TSR gives a more comprehensive picture of the return generated by a stock. We note that for Semapa - Sociedade de Investimento e Gestão SGPS the TSR over the last 3 years was 65%, which is better than the share price return mentioned above. This is largely a result of its dividend payments!
A Different Perspective
It's good to see that Semapa - Sociedade de Investimento e Gestão SGPS has rewarded shareholders with a total shareholder return of 25% in the last twelve months. And that does include the dividend. Since the one-year TSR is better than the five-year TSR (the latter coming in at 10% per year), it would seem that the stock's performance has improved in recent times. Someone with an optimistic perspective could view the recent improvement in TSR as indicating that the business itself is getting better with time. I find it very interesting to look at share price over the long term as a proxy for business performance. But to truly gain insight, we need to consider other information, too. Take risks, for example - Semapa - Sociedade de Investimento e Gestão SGPS has 3 warning signs (and 1 which is potentially serious) we think you should know about.
Of course Semapa - Sociedade de Investimento e Gestão SGPS may not be the best stock to buy. So you may wish to see this free collection of growth stocks.
Please note, the market returns quoted in this article reflect the market weighted average returns of stocks that currently trade on Portuguese exchanges.
New: Manage All Your Stock Portfolios in One Place
We've created the ultimate portfolio companion for stock investors, and it's free.
• Connect an unlimited number of Portfolios and see your total in one currency
• Be alerted to new Warning Signs or Risks via email or mobile
• Track the Fair Value of your stocks
Have feedback on this article? Concerned about the content? Get in touch with us directly. Alternatively, email editorial-team (at) simplywallst.com.
This article by Simply Wall St is general in nature. We provide commentary based on historical data and analyst forecasts only using an unbiased methodology and our articles are not intended to be financial advice. It does not constitute a recommendation to buy or sell any stock, and does not take account of your objectives, or your financial situation. We aim to bring you long-term focused analysis driven by fundamental data. Note that our analysis may not factor in the latest price-sensitive company announcements or qualitative material. Simply Wall St has no position in any stocks mentioned.
About ENXTLS:SEM
Semapa - Sociedade de Investimento e Gestão SGPS
Through its subsidiaries, produces and sells uncoated woodfree (UWF) printing and writing paper in Portugal, rest of Europe, the United States, Africa, Asia, and Oceania.
Undervalued average dividend payer.
Market Insights


Advertisement
Community Narratives
Nike's Direct-to-Consumer Focus Will Drive Future Growth
Fair Value US$87.90|18.2% undervalued
UN
Community Contributor
Novo Nordisk will dominate GLP-1 market with Ozempic and Wegovy growth
Fair Value US$89.59|12.1% undervalued
BE
Community Contributor
Rheinmetall could get 20-25% of EU-NATO 3%-GDP defence spending
Fair Value €7.57k|82.4% undervalued
NO
Community Contributor