- Portugal
- /
- Capital Markets
- /
- ENXTLS:FLEXD
Flexdeal Simfe S.A.'s (ELI:FLEXD) Business Is Yet to Catch Up With Its Share Price
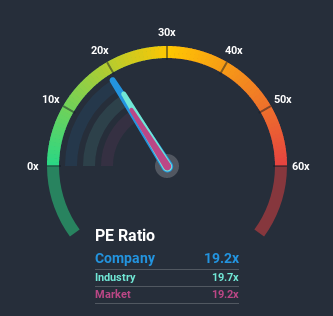
It's not a stretch to say that Flexdeal Simfe S.A.'s (ELI:FLEXD) price-to-earnings (or "P/E") ratio of 19.2x right now seems quite "middle-of-the-road" compared to the market in Portugal, where the median P/E ratio is around 19x. While this might not raise any eyebrows, if the P/E ratio is not justified investors could be missing out on a potential opportunity or ignoring looming disappointment.
It looks like earnings growth has deserted Flexdeal Simfe recently, which is not something to boast about. It might be that many expect the uninspiring earnings performance to only match most other companies at best over the coming period, which has kept the P/E from rising. If you like the company, you'd be hoping this isn't the case so that you could potentially pick up some stock while it's not quite in favour.
Check out our latest analysis for Flexdeal Simfe

Is There Some Growth For Flexdeal Simfe?
In order to justify its P/E ratio, Flexdeal Simfe would need to produce growth that's similar to the market.
Taking a look back first, we see that there was hardly any earnings per share growth to speak of for the company over the past year. The lack of growth did nothing to help the company's aggregate three-year performance, which is an unsavory 62% drop in EPS. Accordingly, shareholders would have felt downbeat about the medium-term rates of earnings growth.
In contrast to the company, the rest of the market is expected to grow by 10% over the next year, which really puts the company's recent medium-term earnings decline into perspective.
In light of this, it's somewhat alarming that Flexdeal Simfe's P/E sits in line with the majority of other companies. It seems most investors are ignoring the recent poor growth rate and are hoping for a turnaround in the company's business prospects. There's a good chance existing shareholders are setting themselves up for future disappointment if the P/E falls to levels more in line with the recent negative growth rates.
What We Can Learn From Flexdeal Simfe's P/E?
It's argued the price-to-earnings ratio is an inferior measure of value within certain industries, but it can be a powerful business sentiment indicator.
Our examination of Flexdeal Simfe revealed its shrinking earnings over the medium-term aren't impacting its P/E as much as we would have predicted, given the market is set to grow. When we see earnings heading backwards and underperforming the market forecasts, we suspect the share price is at risk of declining, sending the moderate P/E lower. If recent medium-term earnings trends continue, it will place shareholders' investments at risk and potential investors in danger of paying an unnecessary premium.
Before you take the next step, you should know about the 5 warning signs for Flexdeal Simfe (1 is significant!) that we have uncovered.
If P/E ratios interest you, you may wish to see this free collection of other companies that have grown earnings strongly and trade on P/E's below 20x.
If you’re looking to trade Flexdeal Simfe, open an account with the lowest-cost* platform trusted by professionals, Interactive Brokers. Their clients from over 200 countries and territories trade stocks, options, futures, forex, bonds and funds worldwide from a single integrated account. Promoted
New: AI Stock Screener & Alerts
Our new AI Stock Screener scans the market every day to uncover opportunities.
• Dividend Powerhouses (3%+ Yield)
• Undervalued Small Caps with Insider Buying
• High growth Tech and AI Companies
Or build your own from over 50 metrics.
This article by Simply Wall St is general in nature. It does not constitute a recommendation to buy or sell any stock, and does not take account of your objectives, or your financial situation. We aim to bring you long-term focused analysis driven by fundamental data. Note that our analysis may not factor in the latest price-sensitive company announcements or qualitative material. Simply Wall St has no position in any stocks mentioned.
*Interactive Brokers Rated Lowest Cost Broker by StockBrokers.com Annual Online Review 2020
Have feedback on this article? Concerned about the content? Get in touch with us directly. Alternatively, email editorial-team (at) simplywallst.com.
About ENXTLS:FLEXD
Adequate balance sheet with low risk.
Market Insights
Community Narratives


