
Advertisement
What Xplus S.A.'s (WSE:XPL) 41% Share Price Gain Is Not Telling You
Xplus S.A. (WSE:XPL) shares have continued their recent momentum with a 41% gain in the last month alone. Looking back a bit further, it's encouraging to see the stock is up 73% in the last year.
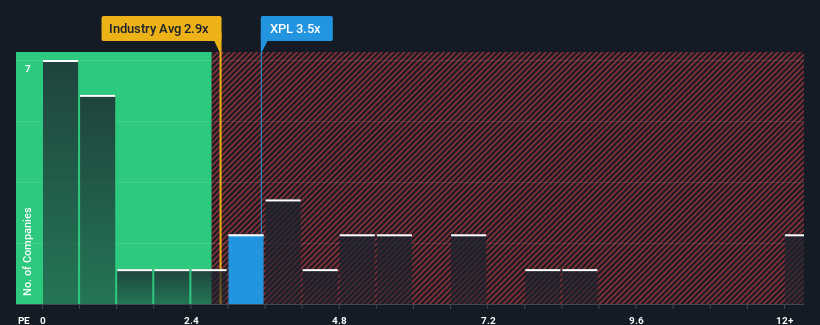
Following the firm bounce in price, Xplus may be sending sell signals at present with a price-to-sales (or "P/S") ratio of 3.5x, when you consider almost half of the companies in the Software industry in Poland have P/S ratios under 2.9x and even P/S lower than 0.6x aren't out of the ordinary. Although, it's not wise to just take the P/S at face value as there may be an explanation why it's as high as it is.
See our latest analysis for Xplus
What Does Xplus' Recent Performance Look Like?
Xplus has been doing a decent job lately as it's been growing revenue at a reasonable pace. It might be that many expect the reasonable revenue performance to beat most other companies over the coming period, which has increased investors’ willingness to pay up for the stock. However, if this isn't the case, investors might get caught out paying too much for the stock.
Want the full picture on earnings, revenue and cash flow for the company? Then our free report on Xplus will help you shine a light on its historical performance.Do Revenue Forecasts Match The High P/S Ratio?
The only time you'd be truly comfortable seeing a P/S as high as Xplus' is when the company's growth is on track to outshine the industry.
Taking a look back first, we see that the company managed to grow revenues by a handy 4.0% last year. The latest three year period has also seen a 17% overall rise in revenue, aided somewhat by its short-term performance. So we can start by confirming that the company has actually done a good job of growing revenue over that time.
It's interesting to note that the rest of the industry is similarly expected to grow by 6.8% over the next year, which is fairly even with the company's recent medium-term annualised growth rates.
In light of this, it's curious that Xplus' P/S sits above the majority of other companies. It seems most investors are ignoring the fairly average recent growth rates and are willing to pay up for exposure to the stock. Nevertheless, they may be setting themselves up for future disappointment if the P/S falls to levels more in line with recent growth rates.
What Does Xplus' P/S Mean For Investors?
Xplus' P/S is on the rise since its shares have risen strongly. It's argued the price-to-sales ratio is an inferior measure of value within certain industries, but it can be a powerful business sentiment indicator.
We didn't expect to see Xplus trade at such a high P/S considering its last three-year revenue growth has only been on par with the rest of the industry. Right now we are uncomfortable with the high P/S as this revenue performance isn't likely to support such positive sentiment for long. If recent medium-term revenue trends continue, it will place shareholders' investments at risk and potential investors in danger of paying an unnecessary premium.
It's always necessary to consider the ever-present spectre of investment risk. We've identified 3 warning signs with Xplus (at least 1 which can't be ignored), and understanding them should be part of your investment process.
Of course, profitable companies with a history of great earnings growth are generally safer bets. So you may wish to see this free collection of other companies that have reasonable P/E ratios and have grown earnings strongly.
New: AI Stock Screener & Alerts
Our new AI Stock Screener scans the market every day to uncover opportunities.
• Dividend Powerhouses (3%+ Yield)
• Undervalued Small Caps with Insider Buying
• High growth Tech and AI Companies
Or build your own from over 50 metrics.
Have feedback on this article? Concerned about the content? Get in touch with us directly. Alternatively, email editorial-team (at) simplywallst.com.
This article by Simply Wall St is general in nature. We provide commentary based on historical data and analyst forecasts only using an unbiased methodology and our articles are not intended to be financial advice. It does not constitute a recommendation to buy or sell any stock, and does not take account of your objectives, or your financial situation. We aim to bring you long-term focused analysis driven by fundamental data. Note that our analysis may not factor in the latest price-sensitive company announcements or qualitative material. Simply Wall St has no position in any stocks mentioned.
About WSE:XPL
Flawless balance sheet with solid track record.
Market Insights

Advertisement
Community Narratives
MicroVision will explode future revenue by 380.37% with a vision towards success
Fair Value US$60.00|98.5% undervalued
TH
Community Contributor
The Indispensable Artery for a New North American Economy
Fair Value CA$132.87|2.3% undervalued
TI
Community Contributor