
Advertisement
Has Xplus S.A.'s (WSE:XPL) Impressive Stock Performance Got Anything to Do With Its Fundamentals?

Xplus' (WSE:XPL) stock is up by a considerable 17% over the past three months. Given that stock prices are usually aligned with a company's financial performance in the long-term, we decided to study its financial indicators more closely to see if they had a hand to play in the recent price move. In this article, we decided to focus on Xplus' ROE.
Return on equity or ROE is a key measure used to assess how efficiently a company's management is utilizing the company's capital. In other words, it is a profitability ratio which measures the rate of return on the capital provided by the company's shareholders.
Check out our latest analysis for Xplus
How To Calculate Return On Equity?
The formula for return on equity is:
Return on Equity = Net Profit (from continuing operations) ÷ Shareholders' Equity
So, based on the above formula, the ROE for Xplus is:
19% = zł3.1m ÷ zł17m (Based on the trailing twelve months to September 2024).
The 'return' is the amount earned after tax over the last twelve months. So, this means that for every PLN1 of its shareholder's investments, the company generates a profit of PLN0.19.
What Is The Relationship Between ROE And Earnings Growth?
We have already established that ROE serves as an efficient profit-generating gauge for a company's future earnings. Depending on how much of these profits the company reinvests or "retains", and how effectively it does so, we are then able to assess a company’s earnings growth potential. Assuming all else is equal, companies that have both a higher return on equity and higher profit retention are usually the ones that have a higher growth rate when compared to companies that don't have the same features.
Xplus' Earnings Growth And 19% ROE
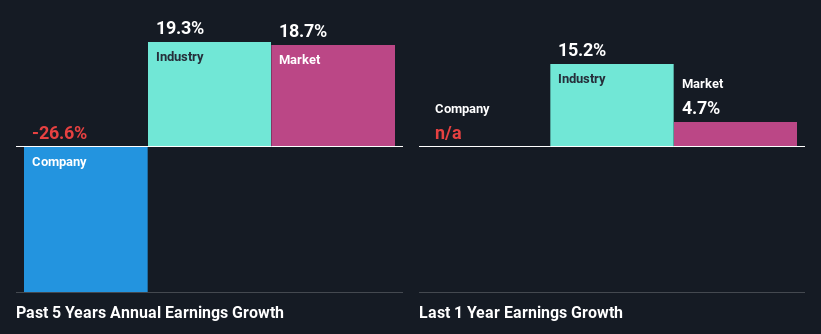
At first glance, Xplus seems to have a decent ROE. Further, the company's ROE is similar to the industry average of 17%. However, while Xplus has a pretty respectable ROE, its five year net income decline rate was 27% . We reckon that there could be some other factors at play here that are preventing the company's growth. For example, it could be that the company has a high payout ratio or the business has allocated capital poorly, for instance.
So, as a next step, we compared Xplus' performance against the industry and were disappointed to discover that while the company has been shrinking its earnings, the industry has been growing its earnings at a rate of 19% over the last few years.
Earnings growth is an important metric to consider when valuing a stock. What investors need to determine next is if the expected earnings growth, or the lack of it, is already built into the share price. Doing so will help them establish if the stock's future looks promising or ominous. Is Xplus fairly valued compared to other companies? These 3 valuation measures might help you decide.
Is Xplus Using Its Retained Earnings Effectively?
With a high three-year median payout ratio of 63% (implying that 37% of the profits are retained), most of Xplus' profits are being paid to shareholders, which explains the company's shrinking earnings. With only a little being reinvested into the business, earnings growth would obviously be low or non-existent. Our risks dashboard should have the 3 risks we have identified for Xplus.
In addition, Xplus has been paying dividends over a period of four years suggesting that keeping up dividend payments is preferred by the management even though earnings have been in decline.
Summary
In total, it does look like Xplus has some positive aspects to its business. However, while the company does have a high ROE, its earnings growth number is quite disappointing. This can be blamed on the fact that it reinvests only a small portion of its profits and pays out the rest as dividends. So far, we've only made a quick discussion around the company's earnings growth. So it may be worth checking this free detailed graph of Xplus' past earnings, as well as revenue and cash flows to get a deeper insight into the company's performance.
New: AI Stock Screener & Alerts
Our new AI Stock Screener scans the market every day to uncover opportunities.
• Dividend Powerhouses (3%+ Yield)
• Undervalued Small Caps with Insider Buying
• High growth Tech and AI Companies
Or build your own from over 50 metrics.
Have feedback on this article? Concerned about the content? Get in touch with us directly. Alternatively, email editorial-team (at) simplywallst.com.
This article by Simply Wall St is general in nature. We provide commentary based on historical data and analyst forecasts only using an unbiased methodology and our articles are not intended to be financial advice. It does not constitute a recommendation to buy or sell any stock, and does not take account of your objectives, or your financial situation. We aim to bring you long-term focused analysis driven by fundamental data. Note that our analysis may not factor in the latest price-sensitive company announcements or qualitative material. Simply Wall St has no position in any stocks mentioned.
About WSE:XPL
Flawless balance sheet with acceptable track record.
Market Insights

Advertisement
Community Narratives
Pinterest will surge as advertising innovations ignite revenue growth
Fair Value US$42.63|27.0% undervalued
BR
Community Contributor
Brambles' Revenue Set to Climb 14% with Profit Margins Following
Fair Value AU$21.90|6.9% overvalued
RO
Community Contributor
Challenging Future for STG as Organic Sales Decline by 8.8%
Fair Value DKK 116.13|26.8% undervalued
KA
Community Contributor