
Advertisement
- Poland
- /
- Life Sciences
- /
- WSE:RVU
Shareholders Of Ryvu Therapeutics (WSE:RVU) Must Be Happy With Their 261% Total Return

Ryvu Therapeutics S.A. (WSE:RVU) shareholders might be concerned after seeing the share price drop 23% in the last quarter. But that scarcely detracts from the really solid long term returns generated by the company over five years. In fact, the share price is 138% higher today. We think it's more important to dwell on the long term returns than the short term returns. Ultimately business performance will determine whether the stock price continues the positive long term trend.
Check out our latest analysis for Ryvu Therapeutics
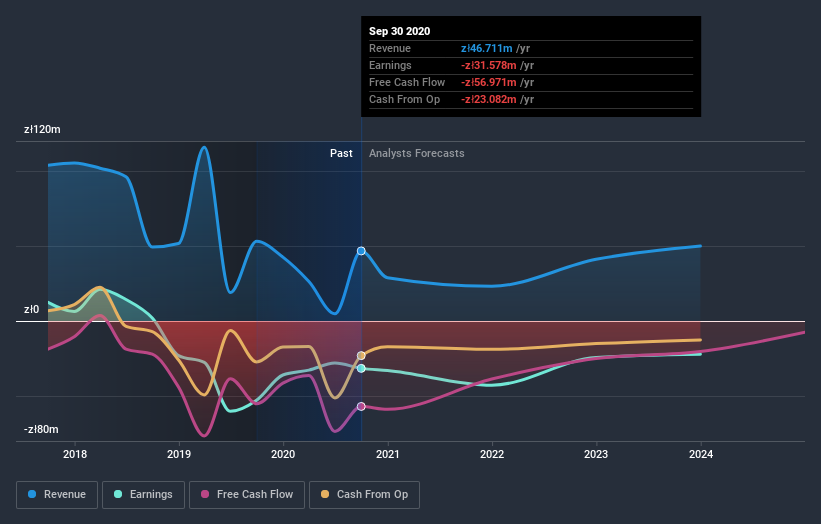
Ryvu Therapeutics wasn't profitable in the last twelve months, it is unlikely we'll see a strong correlation between its share price and its earnings per share (EPS). Arguably revenue is our next best option. Generally speaking, companies without profits are expected to grow revenue every year, and at a good clip. That's because fast revenue growth can be easily extrapolated to forecast profits, often of considerable size.
Over the last half decade Ryvu Therapeutics' revenue has actually been trending down at about 10% per year. On the other hand, the share price done the opposite, gaining 19%, compound, each year. It's a good reminder that expectations about the future, not the past history, always impact share prices. Still, this situation makes us a little wary of the stock.
The graphic below depicts how earnings and revenue have changed over time (unveil the exact values by clicking on the image).
If you are thinking of buying or selling Ryvu Therapeutics stock, you should check out this FREE detailed report on its balance sheet.
What about the Total Shareholder Return (TSR)?
We'd be remiss not to mention the difference between Ryvu Therapeutics' total shareholder return (TSR) and its share price return. The TSR is a return calculation that accounts for the value of cash dividends (assuming that any dividend received was reinvested) and the calculated value of any discounted capital raisings and spin-offs. Ryvu Therapeutics hasn't been paying dividends, but its TSR of 261% exceeds its share price return of 138%, implying it has either spun-off a business, or raised capital at a discount; thereby providing additional value to shareholders.
A Different Perspective
It's good to see that Ryvu Therapeutics has rewarded shareholders with a total shareholder return of 6.7% in the last twelve months. However, the TSR over five years, coming in at 29% per year, is even more impressive. The pessimistic view would be that be that the stock has its best days behind it, but on the other hand the price might simply be moderating while the business itself continues to execute. It's always interesting to track share price performance over the longer term. But to understand Ryvu Therapeutics better, we need to consider many other factors. Consider for instance, the ever-present spectre of investment risk. We've identified 3 warning signs with Ryvu Therapeutics , and understanding them should be part of your investment process.
If you would prefer to check out another company -- one with potentially superior financials -- then do not miss this free list of companies that have proven they can grow earnings.
Please note, the market returns quoted in this article reflect the market weighted average returns of stocks that currently trade on PL exchanges.
If you decide to trade Ryvu Therapeutics, use the lowest-cost* platform that is rated #1 Overall by Barron’s, Interactive Brokers. Trade stocks, options, futures, forex, bonds and funds on 135 markets, all from a single integrated account. Promoted
New: AI Stock Screener & Alerts
Our new AI Stock Screener scans the market every day to uncover opportunities.
• Dividend Powerhouses (3%+ Yield)
• Undervalued Small Caps with Insider Buying
• High growth Tech and AI Companies
Or build your own from over 50 metrics.
This article by Simply Wall St is general in nature. It does not constitute a recommendation to buy or sell any stock, and does not take account of your objectives, or your financial situation. We aim to bring you long-term focused analysis driven by fundamental data. Note that our analysis may not factor in the latest price-sensitive company announcements or qualitative material. Simply Wall St has no position in any stocks mentioned.
*Interactive Brokers Rated Lowest Cost Broker by StockBrokers.com Annual Online Review 2020
Have feedback on this article? Concerned about the content? Get in touch with us directly. Alternatively, email editorial-team@simplywallst.com.
About WSE:RVU
Ryvu Therapeutics
A clinical-stage drug discovery and development company, engages in developing of small molecule therapies for treatment in oncology in Poland, European Union, and internationally.
Excellent balance sheet very low.
Market Insights

Advertisement
Community Narratives
Groundbreaking therapies that could change the treatment landscape for PTSD, fibromyalgia, MS & Alzheimer’s
Fair Value US$6.20|86.9% undervalued
CM
Community Contributor
DigitalOcean Will Grow 14% by Embracing AI with Paperspace Acquisition
Fair Value US$50.00|41.7% undervalued
NE
Community Contributor
Viant Technology: A Rising AdTech Challenger in the AI-Powered CTV Market
Fair Value US$38.61|63.2% undervalued
BL
Community Contributor
Volvo will Accelerate Forward into Electric and Autonomous Leadership in Five Years
Fair Value SEK 438.80|39.7% undervalued
UN
Community Contributor