Fabrity Holding S.A. (WSE:FAB) Stock Has Shown Weakness Lately But Financials Look Strong: Should Prospective Shareholders Make The Leap?


With its stock down 23% over the past three months, it is easy to disregard Fabrity Holding (WSE:FAB). But if you pay close attention, you might gather that its strong financials could mean that the stock could potentially see an increase in value in the long-term, given how markets usually reward companies with good financial health. In this article, we decided to focus on Fabrity Holding's ROE.
Return on equity or ROE is a key measure used to assess how efficiently a company's management is utilizing the company's capital. In short, ROE shows the profit each dollar generates with respect to its shareholder investments.
View our latest analysis for Fabrity Holding
How To Calculate Return On Equity?
The formula for return on equity is:
Return on Equity = Net Profit (from continuing operations) ÷ Shareholders' Equity
So, based on the above formula, the ROE for Fabrity Holding is:
31% = zł14m ÷ zł44m (Based on the trailing twelve months to March 2024).
The 'return' is the yearly profit. That means that for every PLN1 worth of shareholders' equity, the company generated PLN0.31 in profit.
What Has ROE Got To Do With Earnings Growth?
We have already established that ROE serves as an efficient profit-generating gauge for a company's future earnings. We now need to evaluate how much profit the company reinvests or "retains" for future growth which then gives us an idea about the growth potential of the company. Assuming all else is equal, companies that have both a higher return on equity and higher profit retention are usually the ones that have a higher growth rate when compared to companies that don't have the same features.
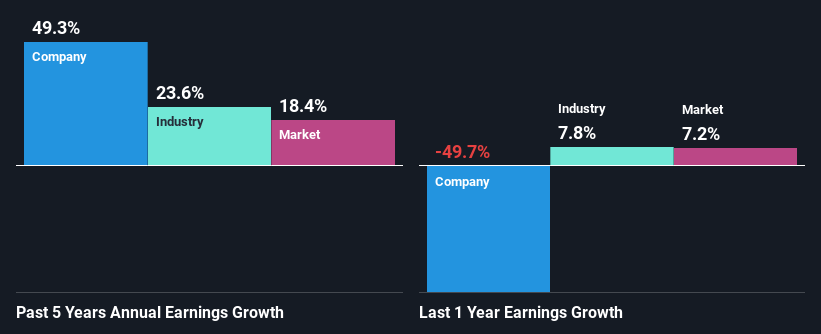
Fabrity Holding's Earnings Growth And 31% ROE
Firstly, we acknowledge that Fabrity Holding has a significantly high ROE. Additionally, the company's ROE is higher compared to the industry average of 18% which is quite remarkable. As a result, Fabrity Holding's exceptional 49% net income growth seen over the past five years, doesn't come as a surprise.
Next, on comparing with the industry net income growth, we found that Fabrity Holding's growth is quite high when compared to the industry average growth of 24% in the same period, which is great to see.
Earnings growth is an important metric to consider when valuing a stock. It’s important for an investor to know whether the market has priced in the company's expected earnings growth (or decline). This then helps them determine if the stock is placed for a bright or bleak future. If you're wondering about Fabrity Holding's's valuation, check out this gauge of its price-to-earnings ratio, as compared to its industry.
Is Fabrity Holding Making Efficient Use Of Its Profits?
The high three-year median payout ratio of 74% (implying that it keeps only 26% of profits) for Fabrity Holding suggests that the company's growth wasn't really hampered despite it returning most of the earnings to its shareholders.
Additionally, Fabrity Holding has paid dividends over a period of nine years which means that the company is pretty serious about sharing its profits with shareholders.
Summary
Overall, we are quite pleased with Fabrity Holding's performance. Especially the high ROE, Which has contributed to the impressive growth seen in earnings. Despite the company reinvesting only a small portion of its profits, it still has managed to grow its earnings so that is appreciable. So far, we've only made a quick discussion around the company's earnings growth. So it may be worth checking this free detailed graph of Fabrity Holding's past earnings, as well as revenue and cash flows to get a deeper insight into the company's performance.
New: AI Stock Screener & Alerts
Our new AI Stock Screener scans the market every day to uncover opportunities.
• Dividend Powerhouses (3%+ Yield)
• Undervalued Small Caps with Insider Buying
• High growth Tech and AI Companies
Or build your own from over 50 metrics.
Have feedback on this article? Concerned about the content? Get in touch with us directly. Alternatively, email editorial-team (at) simplywallst.com.
This article by Simply Wall St is general in nature. We provide commentary based on historical data and analyst forecasts only using an unbiased methodology and our articles are not intended to be financial advice. It does not constitute a recommendation to buy or sell any stock, and does not take account of your objectives, or your financial situation. We aim to bring you long-term focused analysis driven by fundamental data. Note that our analysis may not factor in the latest price-sensitive company announcements or qualitative material. Simply Wall St has no position in any stocks mentioned.
Have feedback on this article? Concerned about the content? Get in touch with us directly. Alternatively, email editorial-team@simplywallst.com
About WSE:FAB
Fabrity Holding
Provides technology and marketing solutions based on artificial intelligence (AI), Big Data, and software in Poland.
Flawless balance sheet, good value and pays a dividend.
Market Insights

Community Narratives


