
Advertisement
- Poland
- /
- Metals and Mining
- /
- WSE:MFO
These 4 Measures Indicate That MFO (WSE:MFO) Is Using Debt Extensively

The external fund manager backed by Berkshire Hathaway's Charlie Munger, Li Lu, makes no bones about it when he says 'The biggest investment risk is not the volatility of prices, but whether you will suffer a permanent loss of capital.' When we think about how risky a company is, we always like to look at its use of debt, since debt overload can lead to ruin. We note that MFO S.A. (WSE:MFO) does have debt on its balance sheet. But should shareholders be worried about its use of debt?
What Risk Does Debt Bring?
Debt assists a business until the business has trouble paying it off, either with new capital or with free cash flow. Ultimately, if the company can't fulfill its legal obligations to repay debt, shareholders could walk away with nothing. However, a more frequent (but still costly) occurrence is where a company must issue shares at bargain-basement prices, permanently diluting shareholders, just to shore up its balance sheet. Of course, the upside of debt is that it often represents cheap capital, especially when it replaces dilution in a company with the ability to reinvest at high rates of return. When we think about a company's use of debt, we first look at cash and debt together.
See our latest analysis for MFO
How Much Debt Does MFO Carry?
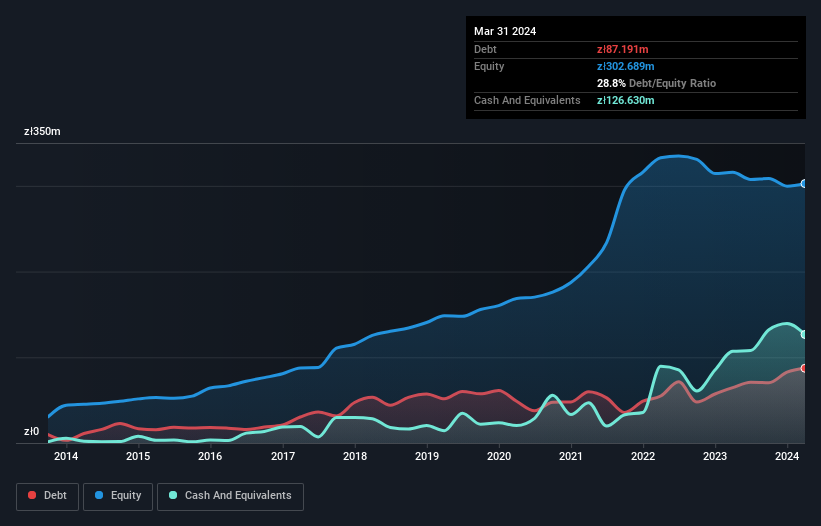
As you can see below, at the end of March 2024, MFO had zł87.2m of debt, up from zł64.5m a year ago. Click the image for more detail. But it also has zł126.6m in cash to offset that, meaning it has zł39.4m net cash.
How Strong Is MFO's Balance Sheet?
We can see from the most recent balance sheet that MFO had liabilities of zł177.9m falling due within a year, and liabilities of zł63.1m due beyond that. Offsetting these obligations, it had cash of zł126.6m as well as receivables valued at zł82.9m due within 12 months. So its liabilities total zł31.6m more than the combination of its cash and short-term receivables.
Given MFO has a market capitalization of zł223.3m, it's hard to believe these liabilities pose much threat. Having said that, it's clear that we should continue to monitor its balance sheet, lest it change for the worse. While it does have liabilities worth noting, MFO also has more cash than debt, so we're pretty confident it can manage its debt safely.
Shareholders should be aware that MFO's EBIT was down 81% last year. If that earnings trend continues then paying off its debt will be about as easy as herding cats on to a roller coaster. When analysing debt levels, the balance sheet is the obvious place to start. But you can't view debt in total isolation; since MFO will need earnings to service that debt. So if you're keen to discover more about its earnings, it might be worth checking out this graph of its long term earnings trend.
Finally, a business needs free cash flow to pay off debt; accounting profits just don't cut it. MFO may have net cash on the balance sheet, but it is still interesting to look at how well the business converts its earnings before interest and tax (EBIT) to free cash flow, because that will influence both its need for, and its capacity to manage debt. Over the most recent three years, MFO recorded free cash flow worth 50% of its EBIT, which is around normal, given free cash flow excludes interest and tax. This cold hard cash means it can reduce its debt when it wants to.
Summing Up
While MFO does have more liabilities than liquid assets, it also has net cash of zł39.4m. So while MFO does not have a great balance sheet, it's certainly not too bad. The balance sheet is clearly the area to focus on when you are analysing debt. However, not all investment risk resides within the balance sheet - far from it. These risks can be hard to spot. Every company has them, and we've spotted 2 warning signs for MFO (of which 1 makes us a bit uncomfortable!) you should know about.
If, after all that, you're more interested in a fast growing company with a rock-solid balance sheet, then check out our list of net cash growth stocks without delay.
New: Manage All Your Stock Portfolios in One Place
We've created the ultimate portfolio companion for stock investors, and it's free.
• Connect an unlimited number of Portfolios and see your total in one currency
• Be alerted to new Warning Signs or Risks via email or mobile
• Track the Fair Value of your stocks
Have feedback on this article? Concerned about the content? Get in touch with us directly. Alternatively, email editorial-team (at) simplywallst.com.
This article by Simply Wall St is general in nature. We provide commentary based on historical data and analyst forecasts only using an unbiased methodology and our articles are not intended to be financial advice. It does not constitute a recommendation to buy or sell any stock, and does not take account of your objectives, or your financial situation. We aim to bring you long-term focused analysis driven by fundamental data. Note that our analysis may not factor in the latest price-sensitive company announcements or qualitative material. Simply Wall St has no position in any stocks mentioned.
Have feedback on this article? Concerned about the content? Get in touch with us directly. Alternatively, email editorial-team@simplywallst.com
About WSE:MFO
Flawless balance sheet low.
Market Insights


Advertisement
Community Narratives
Pole position to benefit from GENIUS Act
Fair Value US$233.04|58.8% undervalued
CH
Community Contributor
IREN will transform from bitcoin miner to leader in AI infrastructure
Fair Value US$21.48|17.5% undervalued
KA
Community Contributor
Behind the Assay: XRF Scientific’s Role in Modern Mining Economics
Fair Value AU$2.10|4.3% undervalued
RO
Community Contributor