- Poland
- /
- Personal Products
- /
- WSE:DMG
Dr. Miele Cosmed Group S.A. (WSE:DMG) Soars 33% But It's A Story Of Risk Vs Reward


Dr. Miele Cosmed Group S.A. (WSE:DMG) shareholders have had their patience rewarded with a 33% share price jump in the last month. Looking back a bit further, it's encouraging to see the stock is up 84% in the last year.
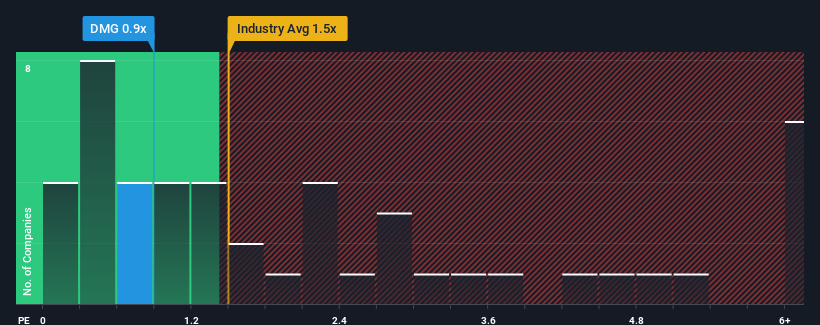
Although its price has surged higher, there still wouldn't be many who think Dr. Miele Cosmed Group's price-to-sales (or "P/S") ratio of 0.9x is worth a mention when the median P/S in Poland's Personal Products industry is similar at about 1.1x. However, investors might be overlooking a clear opportunity or potential setback if there is no rational basis for the P/S.
View our latest analysis for Dr. Miele Cosmed Group
What Does Dr. Miele Cosmed Group's Recent Performance Look Like?
The revenue growth achieved at Dr. Miele Cosmed Group over the last year would be more than acceptable for most companies. One possibility is that the P/S is moderate because investors think this respectable revenue growth might not be enough to outperform the broader industry in the near future. If that doesn't eventuate, then existing shareholders probably aren't too pessimistic about the future direction of the share price.
We don't have analyst forecasts, but you can see how recent trends are setting up the company for the future by checking out our free report on Dr. Miele Cosmed Group's earnings, revenue and cash flow.Do Revenue Forecasts Match The P/S Ratio?
The only time you'd be comfortable seeing a P/S like Dr. Miele Cosmed Group's is when the company's growth is tracking the industry closely.
Retrospectively, the last year delivered a decent 10% gain to the company's revenues. This was backed up an excellent period prior to see revenue up by 31% in total over the last three years. So we can start by confirming that the company has done a great job of growing revenues over that time.
When compared to the industry's one-year growth forecast of 4.9%, the most recent medium-term revenue trajectory is noticeably more alluring
With this information, we find it interesting that Dr. Miele Cosmed Group is trading at a fairly similar P/S compared to the industry. Apparently some shareholders believe the recent performance is at its limits and have been accepting lower selling prices.
The Key Takeaway
Dr. Miele Cosmed Group's stock has a lot of momentum behind it lately, which has brought its P/S level with the rest of the industry. Typically, we'd caution against reading too much into price-to-sales ratios when settling on investment decisions, though it can reveal plenty about what other market participants think about the company.
We didn't quite envision Dr. Miele Cosmed Group's P/S sitting in line with the wider industry, considering the revenue growth over the last three-year is higher than the current industry outlook. There could be some unobserved threats to revenue preventing the P/S ratio from matching this positive performance. While recent revenue trends over the past medium-term suggest that the risk of a price decline is low, investors appear to see the likelihood of revenue fluctuations in the future.
The company's balance sheet is another key area for risk analysis. Our free balance sheet analysis for Dr. Miele Cosmed Group with six simple checks will allow you to discover any risks that could be an issue.
It's important to make sure you look for a great company, not just the first idea you come across. So if growing profitability aligns with your idea of a great company, take a peek at this free list of interesting companies with strong recent earnings growth (and a low P/E).
New: Manage All Your Stock Portfolios in One Place
We've created the ultimate portfolio companion for stock investors, and it's free.
• Connect an unlimited number of Portfolios and see your total in one currency
• Be alerted to new Warning Signs or Risks via email or mobile
• Track the Fair Value of your stocks
Have feedback on this article? Concerned about the content? Get in touch with us directly. Alternatively, email editorial-team (at) simplywallst.com.
This article by Simply Wall St is general in nature. We provide commentary based on historical data and analyst forecasts only using an unbiased methodology and our articles are not intended to be financial advice. It does not constitute a recommendation to buy or sell any stock, and does not take account of your objectives, or your financial situation. We aim to bring you long-term focused analysis driven by fundamental data. Note that our analysis may not factor in the latest price-sensitive company announcements or qualitative material. Simply Wall St has no position in any stocks mentioned.
About WSE:DMG
Dr. Miele Cosmed Group
Engages in the production and sale of chemical and cosmetic assortments in Poland and internationally.
Flawless balance sheet with solid track record.
Market Insights

Community Narratives

