
Advertisement
- Poland
- /
- Hospitality
- /
- WSE:RBW
What Rainbow Tours S.A.'s (WSE:RBW) 26% Share Price Gain Is Not Telling You

Despite an already strong run, Rainbow Tours S.A. (WSE:RBW) shares have been powering on, with a gain of 26% in the last thirty days. The annual gain comes to 156% following the latest surge, making investors sit up and take notice.
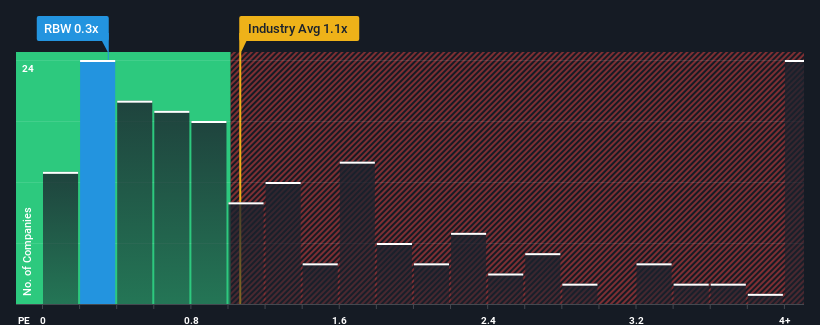
Even after such a large jump in price, you could still be forgiven for feeling indifferent about Rainbow Tours' P/S ratio of 0.3x, since the median price-to-sales (or "P/S") ratio for the Hospitality industry in Poland is also close to 0.5x. While this might not raise any eyebrows, if the P/S ratio is not justified investors could be missing out on a potential opportunity or ignoring looming disappointment.
View our latest analysis for Rainbow Tours
What Does Rainbow Tours' Recent Performance Look Like?
Rainbow Tours certainly has been doing a good job lately as it's been growing revenue more than most other companies. It might be that many expect the strong revenue performance to wane, which has kept the P/S ratio from rising. If you like the company, you'd be hoping this isn't the case so that you could potentially pick up some stock while it's not quite in favour.
Want the full picture on analyst estimates for the company? Then our free report on Rainbow Tours will help you uncover what's on the horizon.How Is Rainbow Tours' Revenue Growth Trending?
The only time you'd be comfortable seeing a P/S like Rainbow Tours' is when the company's growth is tracking the industry closely.
Retrospectively, the last year delivered an exceptional 43% gain to the company's top line. The latest three year period has also seen an incredible overall rise in revenue, aided by its incredible short-term performance. Accordingly, shareholders would have been over the moon with those medium-term rates of revenue growth.
Looking ahead now, revenue is anticipated to climb by 15% per annum during the coming three years according to the one analyst following the company. That's shaping up to be materially lower than the 82% per annum growth forecast for the broader industry.
With this information, we find it interesting that Rainbow Tours is trading at a fairly similar P/S compared to the industry. It seems most investors are ignoring the fairly limited growth expectations and are willing to pay up for exposure to the stock. These shareholders may be setting themselves up for future disappointment if the P/S falls to levels more in line with the growth outlook.
What We Can Learn From Rainbow Tours' P/S?
Its shares have lifted substantially and now Rainbow Tours' P/S is back within range of the industry median. While the price-to-sales ratio shouldn't be the defining factor in whether you buy a stock or not, it's quite a capable barometer of revenue expectations.
When you consider that Rainbow Tours' revenue growth estimates are fairly muted compared to the broader industry, it's easy to see why we consider it unexpected to be trading at its current P/S ratio. At present, we aren't confident in the P/S as the predicted future revenues aren't likely to support a more positive sentiment for long. Circumstances like this present a risk to current and prospective investors who may see share prices fall if the low revenue growth impacts the sentiment.
Having said that, be aware Rainbow Tours is showing 1 warning sign in our investment analysis, you should know about.
Of course, profitable companies with a history of great earnings growth are generally safer bets. So you may wish to see this free collection of other companies that have reasonable P/E ratios and have grown earnings strongly.
New: AI Stock Screener & Alerts
Our new AI Stock Screener scans the market every day to uncover opportunities.
• Dividend Powerhouses (3%+ Yield)
• Undervalued Small Caps with Insider Buying
• High growth Tech and AI Companies
Or build your own from over 50 metrics.
Have feedback on this article? Concerned about the content? Get in touch with us directly. Alternatively, email editorial-team (at) simplywallst.com.
This article by Simply Wall St is general in nature. We provide commentary based on historical data and analyst forecasts only using an unbiased methodology and our articles are not intended to be financial advice. It does not constitute a recommendation to buy or sell any stock, and does not take account of your objectives, or your financial situation. We aim to bring you long-term focused analysis driven by fundamental data. Note that our analysis may not factor in the latest price-sensitive company announcements or qualitative material. Simply Wall St has no position in any stocks mentioned.
About WSE:RBW
Rainbow Tours
Operates as a tour operator in Poland, the Czech Republic, Greece, Spain, Turkey, Slovakia, Lithuania, and internationally.
Flawless balance sheet, good value and pays a dividend.
Market Insights

Advertisement
Community Narratives

BMW cruising ahead with new EVs and premium models to boost revenue 5%
Fair Value €135.07|44.6% undervalued
UN
Community Contributor
EU#2 - From Humble Beginnings to Global Powerhouse
Fair Value DKK 851.04|46.4% undervalued
TO
Community Contributor