- Poland
- /
- Food and Staples Retail
- /
- WSE:EUR
Eurocash S.A.'s (WSE:EUR) Intrinsic Value Is Potentially 92% Above Its Share Price


Key Insights
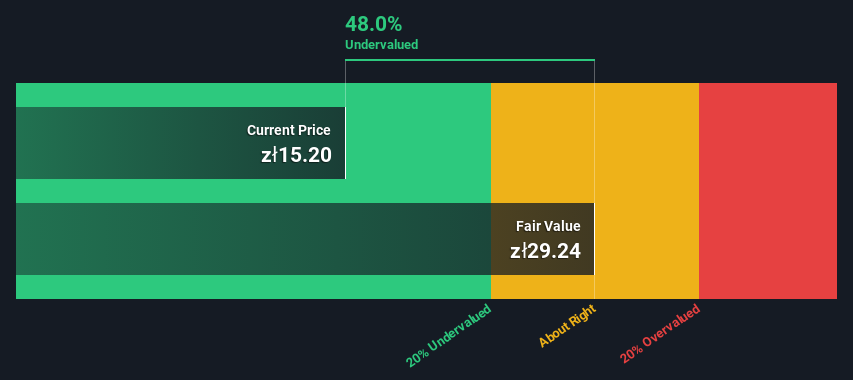
- The projected fair value for Eurocash is zł29.24 based on 2 Stage Free Cash Flow to Equity
- Current share price of zł15.20 suggests Eurocash is potentially 48% undervalued
- Analyst price target for EUR is zł20.68 which is 29% below our fair value estimate
Today we'll do a simple run through of a valuation method used to estimate the attractiveness of Eurocash S.A. (WSE:EUR) as an investment opportunity by projecting its future cash flows and then discounting them to today's value. Our analysis will employ the Discounted Cash Flow (DCF) model. Before you think you won't be able to understand it, just read on! It's actually much less complex than you'd imagine.
Remember though, that there are many ways to estimate a company's value, and a DCF is just one method. Anyone interested in learning a bit more about intrinsic value should have a read of the Simply Wall St analysis model.
View our latest analysis for Eurocash
Step By Step Through The Calculation
We are going to use a two-stage DCF model, which, as the name states, takes into account two stages of growth. The first stage is generally a higher growth period which levels off heading towards the terminal value, captured in the second 'steady growth' period. In the first stage we need to estimate the cash flows to the business over the next ten years. Where possible we use analyst estimates, but when these aren't available we extrapolate the previous free cash flow (FCF) from the last estimate or reported value. We assume companies with shrinking free cash flow will slow their rate of shrinkage, and that companies with growing free cash flow will see their growth rate slow, over this period. We do this to reflect that growth tends to slow more in the early years than it does in later years.
A DCF is all about the idea that a dollar in the future is less valuable than a dollar today, so we need to discount the sum of these future cash flows to arrive at a present value estimate:
10-year free cash flow (FCF) estimate
| 2024 | 2025 | 2026 | 2027 | 2028 | 2029 | 2030 | 2031 | 2032 | 2033 | |
| Levered FCF (PLN, Millions) | zł340.2m | zł353.2m | zł354.3m | zł335.5m | zł352.0m | zł354.1m | zł359.2m | zł366.6m | zł375.7m | zł386.2m |
| Growth Rate Estimate Source | Analyst x5 | Analyst x5 | Analyst x3 | Analyst x2 | Analyst x2 | Est @ 0.59% | Est @ 1.46% | Est @ 2.06% | Est @ 2.48% | Est @ 2.78% |
| Present Value (PLN, Millions) Discounted @ 11% | zł307 | zł288 | zł261 | zł223 | zł211 | zł192 | zł175 | zł162 | zł150 | zł139 |
("Est" = FCF growth rate estimated by Simply Wall St)
Present Value of 10-year Cash Flow (PVCF) = zł2.1b
After calculating the present value of future cash flows in the initial 10-year period, we need to calculate the Terminal Value, which accounts for all future cash flows beyond the first stage. The Gordon Growth formula is used to calculate Terminal Value at a future annual growth rate equal to the 5-year average of the 10-year government bond yield of 3.5%. We discount the terminal cash flows to today's value at a cost of equity of 11%.
Terminal Value (TV)= FCF2033 × (1 + g) ÷ (r – g) = zł386m× (1 + 3.5%) ÷ (11%– 3.5%) = zł5.5b
Present Value of Terminal Value (PVTV)= TV / (1 + r)10= zł5.5b÷ ( 1 + 11%)10= zł2.0b
The total value, or equity value, is then the sum of the present value of the future cash flows, which in this case is zł4.1b. To get the intrinsic value per share, we divide this by the total number of shares outstanding. Relative to the current share price of zł15.2, the company appears quite undervalued at a 48% discount to where the stock price trades currently. The assumptions in any calculation have a big impact on the valuation, so it is better to view this as a rough estimate, not precise down to the last cent.
The Assumptions
We would point out that the most important inputs to a discounted cash flow are the discount rate and of course the actual cash flows. Part of investing is coming up with your own evaluation of a company's future performance, so try the calculation yourself and check your own assumptions. The DCF also does not consider the possible cyclicality of an industry, or a company's future capital requirements, so it does not give a full picture of a company's potential performance. Given that we are looking at Eurocash as potential shareholders, the cost of equity is used as the discount rate, rather than the cost of capital (or weighted average cost of capital, WACC) which accounts for debt. In this calculation we've used 11%, which is based on a levered beta of 1.164. Beta is a measure of a stock's volatility, compared to the market as a whole. We get our beta from the industry average beta of globally comparable companies, with an imposed limit between 0.8 and 2.0, which is a reasonable range for a stable business.
SWOT Analysis for Eurocash
- Earnings growth over the past year exceeded the industry.
- Debt is well covered by cash flow.
- Dividends are covered by earnings and cash flows.
- Interest payments on debt are not well covered.
- Dividend is low compared to the top 25% of dividend payers in the Consumer Retailing market.
- Annual earnings are forecast to grow faster than the Polish market.
- Good value based on P/E ratio and estimated fair value.
- Revenue is forecast to grow slower than 20% per year.
Looking Ahead:
Valuation is only one side of the coin in terms of building your investment thesis, and it ideally won't be the sole piece of analysis you scrutinize for a company. It's not possible to obtain a foolproof valuation with a DCF model. Rather it should be seen as a guide to "what assumptions need to be true for this stock to be under/overvalued?" For instance, if the terminal value growth rate is adjusted slightly, it can dramatically alter the overall result. What is the reason for the share price sitting below the intrinsic value? For Eurocash, we've put together three important factors you should further examine:
- Risks: Take risks, for example - Eurocash has 1 warning sign we think you should be aware of.
- Future Earnings: How does EUR's growth rate compare to its peers and the wider market? Dig deeper into the analyst consensus number for the upcoming years by interacting with our free analyst growth expectation chart.
- Other High Quality Alternatives: Do you like a good all-rounder? Explore our interactive list of high quality stocks to get an idea of what else is out there you may be missing!
PS. The Simply Wall St app conducts a discounted cash flow valuation for every stock on the WSE every day. If you want to find the calculation for other stocks just search here.
If you're looking to trade Eurocash, open an account with the lowest-cost platform trusted by professionals, Interactive Brokers.
With clients in over 200 countries and territories, and access to 160 markets, IBKR lets you trade stocks, options, futures, forex, bonds and funds from a single integrated account.
Enjoy no hidden fees, no account minimums, and FX conversion rates as low as 0.03%, far better than what most brokers offer.
Sponsored ContentValuation is complex, but we're here to simplify it.
Discover if Eurocash might be undervalued or overvalued with our detailed analysis, featuring fair value estimates, potential risks, dividends, insider trades, and its financial condition.
Access Free AnalysisHave feedback on this article? Concerned about the content? Get in touch with us directly. Alternatively, email editorial-team (at) simplywallst.com.
This article by Simply Wall St is general in nature. We provide commentary based on historical data and analyst forecasts only using an unbiased methodology and our articles are not intended to be financial advice. It does not constitute a recommendation to buy or sell any stock, and does not take account of your objectives, or your financial situation. We aim to bring you long-term focused analysis driven by fundamental data. Note that our analysis may not factor in the latest price-sensitive company announcements or qualitative material. Simply Wall St has no position in any stocks mentioned.
About WSE:EUR
Eurocash
Engages in the wholesale distribution of food and other fast moving consumer goods (FMCG) in Poland.
Undervalued with moderate growth potential.

