

Warren Buffett famously said, 'Volatility is far from synonymous with risk.' It's only natural to consider a company's balance sheet when you examine how risky it is, since debt is often involved when a business collapses. Importantly, Monnari Trade S.A. (WSE:MON) does carry debt. But should shareholders be worried about its use of debt?
When Is Debt Dangerous?
Generally speaking, debt only becomes a real problem when a company can't easily pay it off, either by raising capital or with its own cash flow. If things get really bad, the lenders can take control of the business. However, a more frequent (but still costly) occurrence is where a company must issue shares at bargain-basement prices, permanently diluting shareholders, just to shore up its balance sheet. Having said that, the most common situation is where a company manages its debt reasonably well - and to its own advantage. When we think about a company's use of debt, we first look at cash and debt together.
View our latest analysis for Monnari Trade
What Is Monnari Trade's Debt?
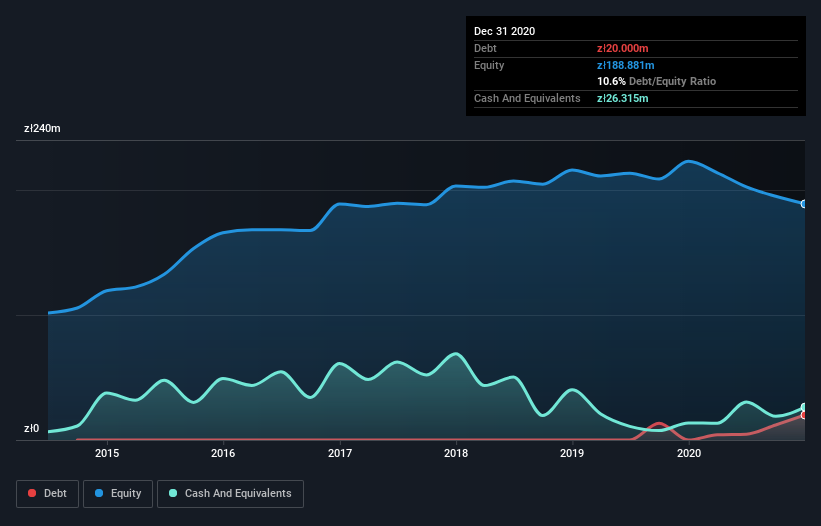
The image below, which you can click on for greater detail, shows that at December 2020 Monnari Trade had debt of zł20.0m, up from zł2.0k in one year. However, its balance sheet shows it holds zł26.3m in cash, so it actually has zł6.32m net cash.
How Healthy Is Monnari Trade's Balance Sheet?
The latest balance sheet data shows that Monnari Trade had liabilities of zł70.2m due within a year, and liabilities of zł50.7m falling due after that. Offsetting this, it had zł26.3m in cash and zł33.5m in receivables that were due within 12 months. So it has liabilities totalling zł61.1m more than its cash and near-term receivables, combined.
This deficit is considerable relative to its market capitalization of zł70.3m, so it does suggest shareholders should keep an eye on Monnari Trade's use of debt. Should its lenders demand that it shore up the balance sheet, shareholders would likely face severe dilution. While it does have liabilities worth noting, Monnari Trade also has more cash than debt, so we're pretty confident it can manage its debt safely. The balance sheet is clearly the area to focus on when you are analysing debt. But you can't view debt in total isolation; since Monnari Trade will need earnings to service that debt. So when considering debt, it's definitely worth looking at the earnings trend. Click here for an interactive snapshot.
In the last year Monnari Trade had a loss before interest and tax, and actually shrunk its revenue by 26%, to zł209m. To be frank that doesn't bode well.
So How Risky Is Monnari Trade?
Although Monnari Trade had an earnings before interest and tax (EBIT) loss over the last twelve months, it generated positive free cash flow of zł32m. So although it is loss-making, it doesn't seem to have too much near-term balance sheet risk, keeping in mind the net cash. Until we see some positive EBIT, we're a bit cautious of the stock, not least because of the rather modest revenue growth. When analysing debt levels, the balance sheet is the obvious place to start. However, not all investment risk resides within the balance sheet - far from it. For instance, we've identified 3 warning signs for Monnari Trade (1 is significant) you should be aware of.
Of course, if you're the type of investor who prefers buying stocks without the burden of debt, then don't hesitate to discover our exclusive list of net cash growth stocks, today.
When trading Monnari Trade or any other investment, use the platform considered by many to be the Professional's Gateway to the Worlds Market, Interactive Brokers. You get the lowest-cost* trading on stocks, options, futures, forex, bonds and funds worldwide from a single integrated account. Promoted
New: Manage All Your Stock Portfolios in One Place
We've created the ultimate portfolio companion for stock investors, and it's free.
• Connect an unlimited number of Portfolios and see your total in one currency
• Be alerted to new Warning Signs or Risks via email or mobile
• Track the Fair Value of your stocks
This article by Simply Wall St is general in nature. It does not constitute a recommendation to buy or sell any stock, and does not take account of your objectives, or your financial situation. We aim to bring you long-term focused analysis driven by fundamental data. Note that our analysis may not factor in the latest price-sensitive company announcements or qualitative material. Simply Wall St has no position in any stocks mentioned.
*Interactive Brokers Rated Lowest Cost Broker by StockBrokers.com Annual Online Review 2020
Have feedback on this article? Concerned about the content? Get in touch with us directly. Alternatively, email editorial-team (at) simplywallst.com.
About WSE:MON
Monnari Trade
Engages in the design, production, marketing, and sale of clothing products and accessories for women in Poland.
Solid track record with excellent balance sheet.

