
Advertisement
Key Insights
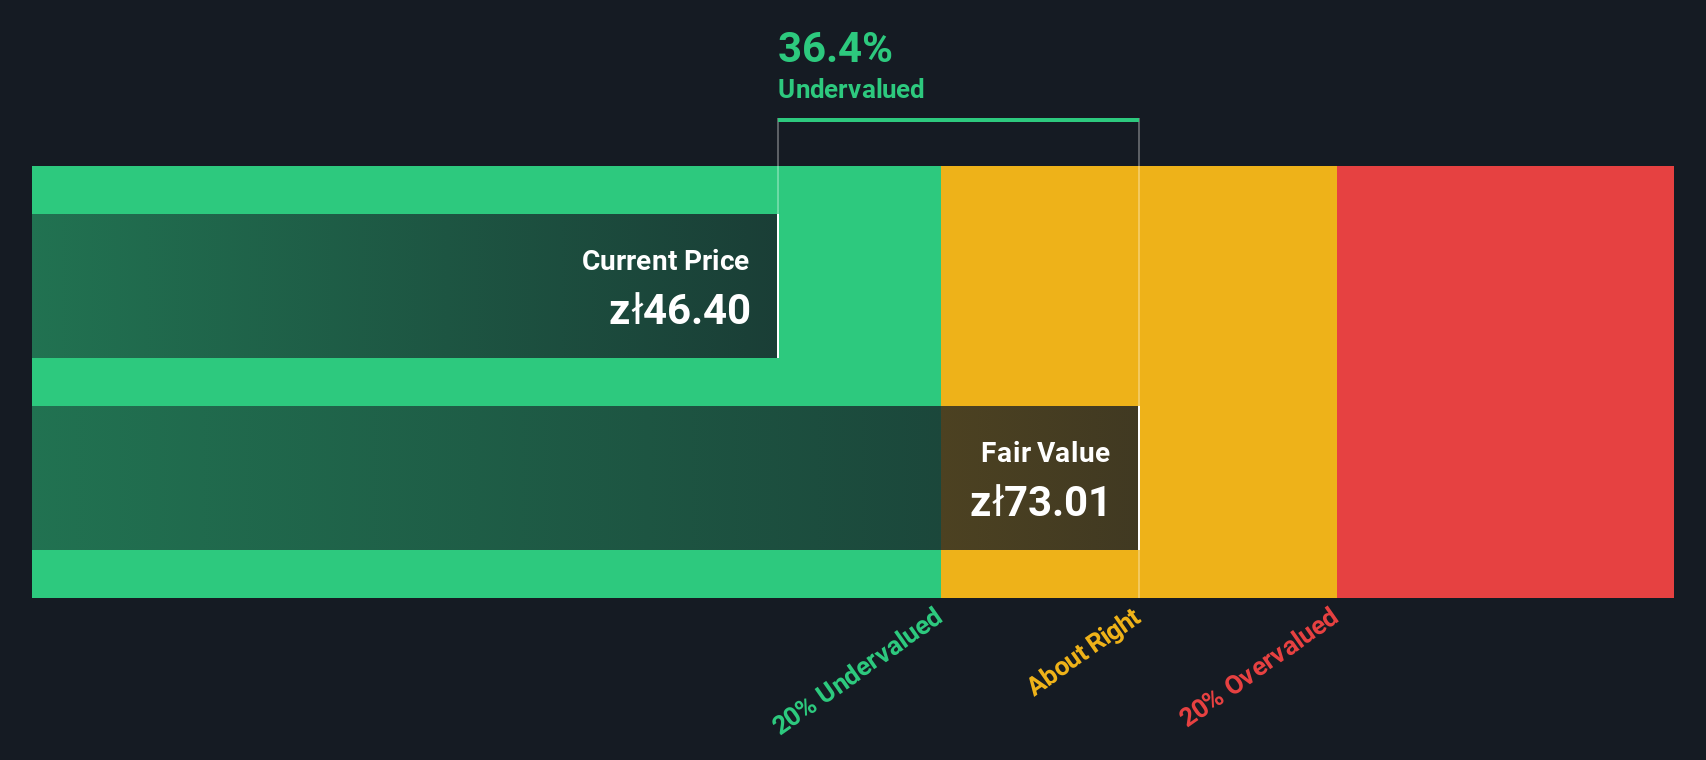
- Using the 2 Stage Free Cash Flow to Equity, Archicom fair value estimate is zł73.01
- Current share price of zł46.40 suggests Archicom is potentially 36% undervalued
- Our fair value estimate is 45% higher than Archicom's analyst price target of zł50.30
Today we will run through one way of estimating the intrinsic value of Archicom S.A. (WSE:ARH) by taking the expected future cash flows and discounting them to their present value. This will be done using the Discounted Cash Flow (DCF) model. Models like these may appear beyond the comprehension of a lay person, but they're fairly easy to follow.
Companies can be valued in a lot of ways, so we would point out that a DCF is not perfect for every situation. Anyone interested in learning a bit more about intrinsic value should have a read of the Simply Wall St analysis model.
Is Archicom Fairly Valued?
We are going to use a two-stage DCF model, which, as the name states, takes into account two stages of growth. The first stage is generally a higher growth period which levels off heading towards the terminal value, captured in the second 'steady growth' period. To begin with, we have to get estimates of the next ten years of cash flows. Where possible we use analyst estimates, but when these aren't available we extrapolate the previous free cash flow (FCF) from the last estimate or reported value. We assume companies with shrinking free cash flow will slow their rate of shrinkage, and that companies with growing free cash flow will see their growth rate slow, over this period. We do this to reflect that growth tends to slow more in the early years than it does in later years.
Generally we assume that a dollar today is more valuable than a dollar in the future, and so the sum of these future cash flows is then discounted to today's value:
10-year free cash flow (FCF) forecast
| 2026 | 2027 | 2028 | 2029 | 2030 | 2031 | 2032 | 2033 | 2034 | 2035 | |
| Levered FCF (PLN, Millions) | zł131.5m | zł275.5m | zł235.5m | zł288.0m | zł329.2m | zł366.8m | zł401.1m | zł433.1m | zł463.2m | zł492.2m |
| Growth Rate Estimate Source | Analyst x2 | Analyst x2 | Analyst x2 | Analyst x2 | Est @ 14.31% | Est @ 11.41% | Est @ 9.38% | Est @ 7.96% | Est @ 6.96% | Est @ 6.26% |
| Present Value (PLN, Millions) Discounted @ 12% | zł118 | zł221 | zł170 | zł186 | zł190 | zł190 | zł186 | zł180 | zł173 | zł165 |
("Est" = FCF growth rate estimated by Simply Wall St)
Present Value of 10-year Cash Flow (PVCF) = zł1.8b
After calculating the present value of future cash flows in the initial 10-year period, we need to calculate the Terminal Value, which accounts for all future cash flows beyond the first stage. The Gordon Growth formula is used to calculate Terminal Value at a future annual growth rate equal to the 5-year average of the 10-year government bond yield of 4.6%. We discount the terminal cash flows to today's value at a cost of equity of 12%.
Terminal Value (TV)= FCF2035 × (1 + g) ÷ (r – g) = zł492m× (1 + 4.6%) ÷ (12%– 4.6%) = zł7.4b
Present Value of Terminal Value (PVTV)= TV / (1 + r)10= zł7.4b÷ ( 1 + 12%)10= zł2.5b
The total value, or equity value, is then the sum of the present value of the future cash flows, which in this case is zł4.3b. The last step is to then divide the equity value by the number of shares outstanding. Relative to the current share price of zł46.4, the company appears quite undervalued at a 36% discount to where the stock price trades currently. Valuations are imprecise instruments though, rather like a telescope - move a few degrees and end up in a different galaxy. Do keep this in mind.
The Assumptions
The calculation above is very dependent on two assumptions. The first is the discount rate and the other is the cash flows. You don't have to agree with these inputs, I recommend redoing the calculations yourself and playing with them. The DCF also does not consider the possible cyclicality of an industry, or a company's future capital requirements, so it does not give a full picture of a company's potential performance. Given that we are looking at Archicom as potential shareholders, the cost of equity is used as the discount rate, rather than the cost of capital (or weighted average cost of capital, WACC) which accounts for debt. In this calculation we've used 12%, which is based on a levered beta of 1.268. Beta is a measure of a stock's volatility, compared to the market as a whole. We get our beta from the industry average beta of globally comparable companies, with an imposed limit between 0.8 and 2.0, which is a reasonable range for a stable business.
Check out our latest analysis for Archicom
SWOT Analysis for Archicom
Strength
- Debt is well covered by earnings and cashflows.
- Dividend is in the top 25% of dividend payers in the market.
Weakness
- Earnings declined over the past year.
Opportunity
- Annual earnings are forecast to grow faster than the Polish market.
- Trading below our estimate of fair value by more than 20%.
Threat
- Dividends are not covered by earnings and cashflows.
Next Steps:
Valuation is only one side of the coin in terms of building your investment thesis, and it ideally won't be the sole piece of analysis you scrutinize for a company. The DCF model is not a perfect stock valuation tool. Preferably you'd apply different cases and assumptions and see how they would impact the company's valuation. For instance, if the terminal value growth rate is adjusted slightly, it can dramatically alter the overall result. What is the reason for the share price sitting below the intrinsic value? For Archicom, there are three fundamental items you should further research:
- Risks: You should be aware of the 4 warning signs for Archicom (1 is a bit unpleasant!) we've uncovered before considering an investment in the company.
- Future Earnings: How does ARH's growth rate compare to its peers and the wider market? Dig deeper into the analyst consensus number for the upcoming years by interacting with our free analyst growth expectation chart.
- Other High Quality Alternatives: Do you like a good all-rounder? Explore our interactive list of high quality stocks to get an idea of what else is out there you may be missing!
PS. The Simply Wall St app conducts a discounted cash flow valuation for every stock on the WSE every day. If you want to find the calculation for other stocks just search here.
New: Manage All Your Stock Portfolios in One Place
We've created the ultimate portfolio companion for stock investors, and it's free.
• Connect an unlimited number of Portfolios and see your total in one currency
• Be alerted to new Warning Signs or Risks via email or mobile
• Track the Fair Value of your stocks
Have feedback on this article? Concerned about the content? Get in touch with us directly. Alternatively, email editorial-team (at) simplywallst.com.
This article by Simply Wall St is general in nature. We provide commentary based on historical data and analyst forecasts only using an unbiased methodology and our articles are not intended to be financial advice. It does not constitute a recommendation to buy or sell any stock, and does not take account of your objectives, or your financial situation. We aim to bring you long-term focused analysis driven by fundamental data. Note that our analysis may not factor in the latest price-sensitive company announcements or qualitative material. Simply Wall St has no position in any stocks mentioned.
About WSE:ARH
Exceptional growth potential with slight risk.
Market Insights

Advertisement
Weekly Picks
WO

woodworthfund on MGP Ingredients ·
THE KINGDOM OF BROWN GOODS: WHY MGPI IS BEING CRUSHED BY INVENTORY & PRIMED FOR RESURRECTION
Fair Value:US$4034.1% undervalued
16 followersusers have followed this narrative
1 commentusers have commented on this narrative
4 likesusers have liked this narrative
DO


Double_Bubbler on Vertical Aerospace ·
Why Vertical Aerospace (NYSE: EVTL) is Worth Possibly Over 13x its Current Price
Fair Value:US$6090.0% undervalued
21 followersusers have followed this narrative
1 commentusers have commented on this narrative
15 likesusers have liked this narrative
TI


TickerTickle on Oracle ·
The Quiet Giant That Became AI’s Power Grid
Fair Value:US$389.8142.7% undervalued
32 followersusers have followed this narrative
2 commentsusers have commented on this narrative
8 likesusers have liked this narrative
Recently Updated Narratives
MA


MarkoVT on ANYCOLOR ·
Near zero debt, Japan centric focus provides future growth
Fair Value:JP¥7.11k18.9% undervalued
1 followerusers have followed this narrative
0 commentsusers have commented on this narrative
0 likesusers have liked this narrative
LE

lexdrew1 on GE Vernova ·
GE Vernova revenue will grow by 13% with a future PE of 64.7x
Fair Value:US$824.5724.2% undervalued
8 followersusers have followed this narrative
0 commentsusers have commented on this narrative
0 likesusers have liked this narrative
GI

Gil263 on Butterfly Network ·
A buy recommendation
Fair Value:US$1.869.4% overvalued
2 followersusers have followed this narrative
1 commentusers have commented on this narrative
0 likesusers have liked this narrative
Popular Narratives
TH


TheWallstreetKing on MicroVision ·
MicroVision will explode future revenue by 380.37% with a vision towards success
Fair Value:US$6098.4% undervalued
119 followersusers have followed this narrative
11 commentsusers have commented on this narrative
22 likesusers have liked this narrative
AN


AnalystConsensusTarget on NVIDIA ·
NVDA: Expanding AI Demand Will Drive Major Data Center Investments Through 2026
Fair Value:US$250.3926.7% undervalued
963 followersusers have followed this narrative
6 commentsusers have commented on this narrative
25 likesusers have liked this narrative
RO


RockeTeller on Santacruz Silver Mining ·
Crazy Undervalued 42 Baggers Silver Play (Active & Running Mine)
Fair Value:CA$8684.3% undervalued
76 followersusers have followed this narrative
8 commentsusers have commented on this narrative
21 likesusers have liked this narrative
