
Advertisement
- Poland
- /
- Construction
- /
- WSE:OND
Is Onde S.A.'s (WSE:OND) Recent Performance Underpinned By Weak Financials?

Onde (WSE:OND) has had a rough three months with its share price down 14%. To decide if this trend could continue, we decided to look at its weak fundamentals as they shape the long-term market trends. Particularly, we will be paying attention to Onde's ROE today.
Return on equity or ROE is a key measure used to assess how efficiently a company's management is utilizing the company's capital. In short, ROE shows the profit each dollar generates with respect to its shareholder investments.
How Is ROE Calculated?
Return on equity can be calculated by using the formula:
Return on Equity = Net Profit (from continuing operations) ÷ Shareholders' Equity
So, based on the above formula, the ROE for Onde is:
2.1% = zł7.3m ÷ zł352m (Based on the trailing twelve months to March 2025).
The 'return' is the profit over the last twelve months. That means that for every PLN1 worth of shareholders' equity, the company generated PLN0.02 in profit.
See our latest analysis for Onde
What Is The Relationship Between ROE And Earnings Growth?
So far, we've learned that ROE is a measure of a company's profitability. Based on how much of its profits the company chooses to reinvest or "retain", we are then able to evaluate a company's future ability to generate profits. Generally speaking, other things being equal, firms with a high return on equity and profit retention, have a higher growth rate than firms that don’t share these attributes.
Onde's Earnings Growth And 2.1% ROE
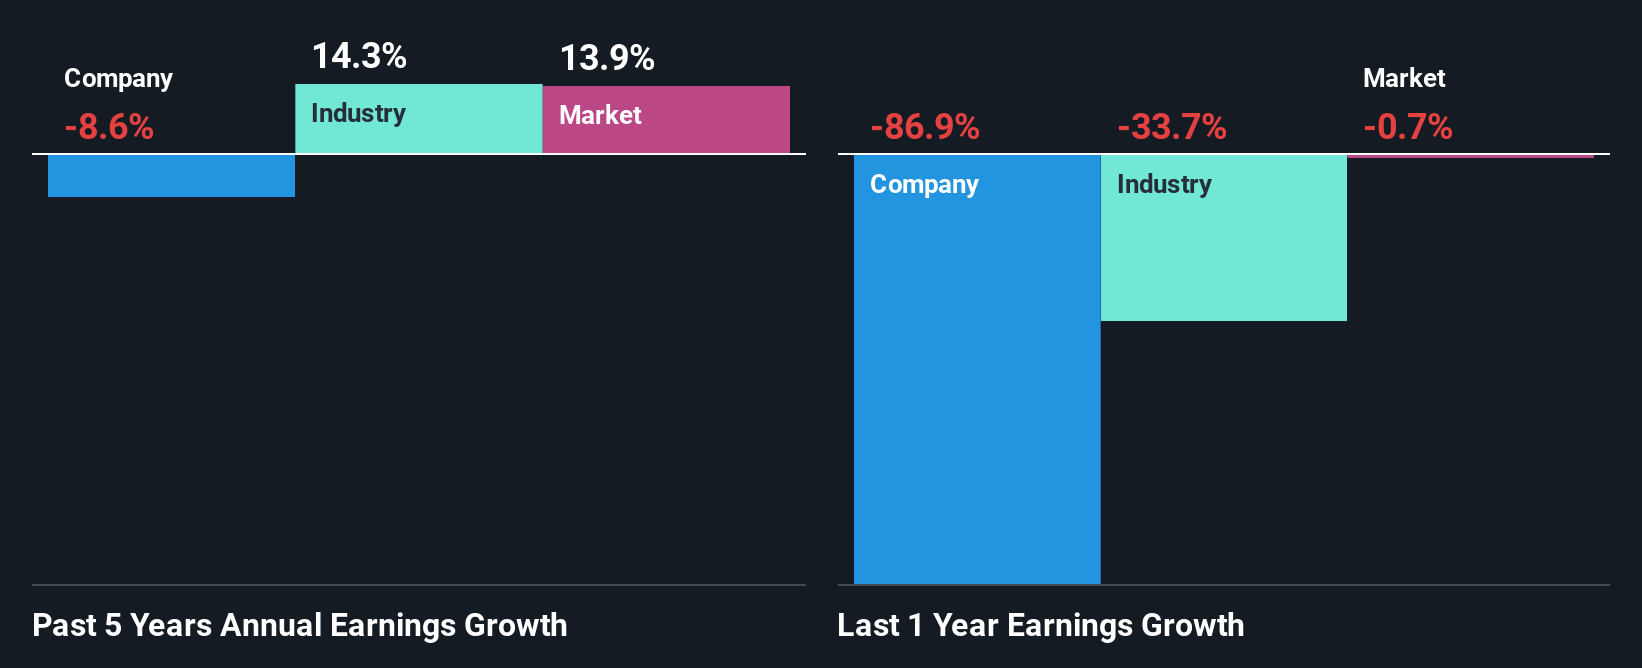
As you can see, Onde's ROE looks pretty weak. Not just that, even compared to the industry average of 9.0%, the company's ROE is entirely unremarkable. Therefore, it might not be wrong to say that the five year net income decline of 8.6% seen by Onde was possibly a result of it having a lower ROE. However, there could also be other factors causing the earnings to decline. Such as - low earnings retention or poor allocation of capital.
That being said, we compared Onde's performance with the industry and were concerned when we found that while the company has shrunk its earnings, the industry has grown its earnings at a rate of 14% in the same 5-year period.
The basis for attaching value to a company is, to a great extent, tied to its earnings growth. The investor should try to establish if the expected growth or decline in earnings, whichever the case may be, is priced in. By doing so, they will have an idea if the stock is headed into clear blue waters or if swampy waters await. One good indicator of expected earnings growth is the P/E ratio which determines the price the market is willing to pay for a stock based on its earnings prospects. So, you may want to check if Onde is trading on a high P/E or a low P/E, relative to its industry.
Is Onde Making Efficient Use Of Its Profits?
Onde has a high three-year median payout ratio of 52% (that is, it is retaining 48% of its profits). This suggests that the company is paying most of its profits as dividends to its shareholders. This goes some way in explaining why its earnings have been shrinking. With only very little left to reinvest into the business, growth in earnings is far from likely. You can see the 4 risks we have identified for Onde by visiting our risks dashboard for free on our platform here.
Additionally, Onde started paying a dividend only recently. So it looks like the management may have perceived that shareholders favor dividends even though earnings have been in decline.
Conclusion
In total, we would have a hard think before deciding on any investment action concerning Onde. The company has seen a lack of earnings growth as a result of retaining very little profits and whatever little it does retain, is being reinvested at a very low rate of return. Up till now, we've only made a short study of the company's growth data. So it may be worth checking this free detailed graph of Onde's past earnings, as well as revenue and cash flows to get a deeper insight into the company's performance.
New: AI Stock Screener & Alerts
Our new AI Stock Screener scans the market every day to uncover opportunities.
• Dividend Powerhouses (3%+ Yield)
• Undervalued Small Caps with Insider Buying
• High growth Tech and AI Companies
Or build your own from over 50 metrics.
Have feedback on this article? Concerned about the content? Get in touch with us directly. Alternatively, email editorial-team (at) simplywallst.com.
This article by Simply Wall St is general in nature. We provide commentary based on historical data and analyst forecasts only using an unbiased methodology and our articles are not intended to be financial advice. It does not constitute a recommendation to buy or sell any stock, and does not take account of your objectives, or your financial situation. We aim to bring you long-term focused analysis driven by fundamental data. Note that our analysis may not factor in the latest price-sensitive company announcements or qualitative material. Simply Wall St has no position in any stocks mentioned.
About WSE:OND
Onde
Engages in the designing and construction solutions for the renewable energy sector in Poland and internationally.
Excellent balance sheet slight.
Similar Companies
Market Insights


Advertisement
Community Narratives
Suncorp’s Next Chapter: Insurance-Only and Ready to Grow
Fair Value AU$22.83|5.7% undervalued
RO
Community Contributor
Thyssenkrupp Nucera Will Achieve Double-Digit Profits by 2030 Boosted by Hydrogen Growth
Fair Value €14.40|31.6% undervalued
CH
Community Contributor
Tesla’s Nvidia Moment – The AI & Robotics Inflection Point
Fair Value US$384.84|18.0% undervalued
BL
Community Contributor