- Poland
- /
- Construction
- /
- WSE:FKD
A Look At The Fair Value Of Fabryka Konstrukcji Drewnianych S.A. (WSE:FKD)


Key Insights
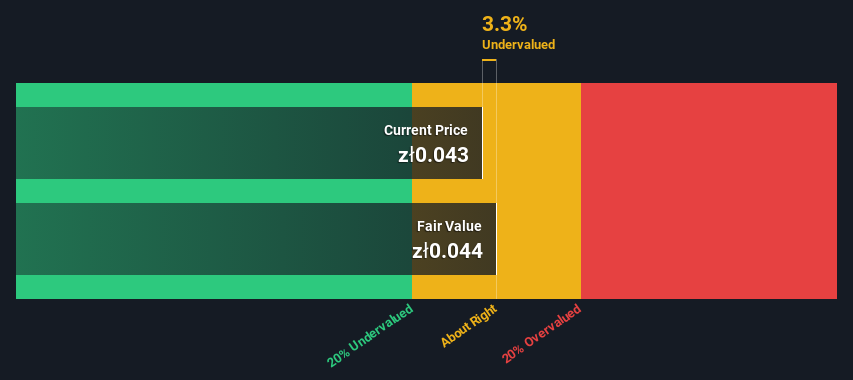
- Fabryka Konstrukcji Drewnianych's estimated fair value is zł0.044 based on 2 Stage Free Cash Flow to Equity
- Current share price of zł0.043 suggests Fabryka Konstrukcji Drewnianych is potentially trading close to its fair value
- The average premium for Fabryka Konstrukcji Drewnianych's competitorsis currently 85%
Today we will run through one way of estimating the intrinsic value of Fabryka Konstrukcji Drewnianych S.A. (WSE:FKD) by projecting its future cash flows and then discounting them to today's value. We will use the Discounted Cash Flow (DCF) model on this occasion. It may sound complicated, but actually it is quite simple!
We generally believe that a company's value is the present value of all of the cash it will generate in the future. However, a DCF is just one valuation metric among many, and it is not without flaws. If you want to learn more about discounted cash flow, the rationale behind this calculation can be read in detail in the Simply Wall St analysis model.
View our latest analysis for Fabryka Konstrukcji Drewnianych
What's The Estimated Valuation?
We use what is known as a 2-stage model, which simply means we have two different periods of growth rates for the company's cash flows. Generally the first stage is higher growth, and the second stage is a lower growth phase. To start off with, we need to estimate the next ten years of cash flows. Seeing as no analyst estimates of free cash flow are available to us, we have extrapolate the previous free cash flow (FCF) from the company's last reported value. We assume companies with shrinking free cash flow will slow their rate of shrinkage, and that companies with growing free cash flow will see their growth rate slow, over this period. We do this to reflect that growth tends to slow more in the early years than it does in later years.
A DCF is all about the idea that a dollar in the future is less valuable than a dollar today, so we need to discount the sum of these future cash flows to arrive at a present value estimate:
10-year free cash flow (FCF) forecast
| 2024 | 2025 | 2026 | 2027 | 2028 | 2029 | 2030 | 2031 | 2032 | 2033 | |
| Levered FCF (PLN, Millions) | zł65.9k | zł99.7k | zł136.8k | zł173.9k | zł208.8k | zł240.5k | zł268.7k | zł293.8k | zł316.3k | zł336.7k |
| Growth Rate Estimate Source | Est @ 71.90% | Est @ 51.45% | Est @ 37.13% | Est @ 27.11% | Est @ 20.09% | Est @ 15.18% | Est @ 11.74% | Est @ 9.33% | Est @ 7.65% | Est @ 6.47% |
| Present Value (PLN, Millions) Discounted @ 15% | zł0.06 | zł0.07 | zł0.09 | zł0.1 | zł0.1 | zł0.1 | zł0.1 | zł0.09 | zł0.09 | zł0.08 |
("Est" = FCF growth rate estimated by Simply Wall St)
Present Value of 10-year Cash Flow (PVCF) = zł882k
After calculating the present value of future cash flows in the initial 10-year period, we need to calculate the Terminal Value, which accounts for all future cash flows beyond the first stage. The Gordon Growth formula is used to calculate Terminal Value at a future annual growth rate equal to the 5-year average of the 10-year government bond yield of 3.7%. We discount the terminal cash flows to today's value at a cost of equity of 15%.
Terminal Value (TV)= FCF2033 × (1 + g) ÷ (r – g) = zł337k× (1 + 3.7%) ÷ (15%– 3.7%) = zł3.0m
Present Value of Terminal Value (PVTV)= TV / (1 + r)10= zł3.0m÷ ( 1 + 15%)10= zł714k
The total value, or equity value, is then the sum of the present value of the future cash flows, which in this case is zł1.6m. In the final step we divide the equity value by the number of shares outstanding. Relative to the current share price of zł0.04, the company appears about fair value at a 3.3% discount to where the stock price trades currently. The assumptions in any calculation have a big impact on the valuation, so it is better to view this as a rough estimate, not precise down to the last cent.
Important Assumptions
The calculation above is very dependent on two assumptions. The first is the discount rate and the other is the cash flows. If you don't agree with these result, have a go at the calculation yourself and play with the assumptions. The DCF also does not consider the possible cyclicality of an industry, or a company's future capital requirements, so it does not give a full picture of a company's potential performance. Given that we are looking at Fabryka Konstrukcji Drewnianych as potential shareholders, the cost of equity is used as the discount rate, rather than the cost of capital (or weighted average cost of capital, WACC) which accounts for debt. In this calculation we've used 15%, which is based on a levered beta of 2.000. Beta is a measure of a stock's volatility, compared to the market as a whole. We get our beta from the industry average beta of globally comparable companies, with an imposed limit between 0.8 and 2.0, which is a reasonable range for a stable business.
Moving On:
Although the valuation of a company is important, it ideally won't be the sole piece of analysis you scrutinize for a company. The DCF model is not a perfect stock valuation tool. Instead the best use for a DCF model is to test certain assumptions and theories to see if they would lead to the company being undervalued or overvalued. If a company grows at a different rate, or if its cost of equity or risk free rate changes sharply, the output can look very different. For Fabryka Konstrukcji Drewnianych, there are three important elements you should further research:
- Risks: Every company has them, and we've spotted 4 warning signs for Fabryka Konstrukcji Drewnianych (of which 3 are a bit unpleasant!) you should know about.
- Other Solid Businesses: Low debt, high returns on equity and good past performance are fundamental to a strong business. Why not explore our interactive list of stocks with solid business fundamentals to see if there are other companies you may not have considered!
- Other Top Analyst Picks: Interested to see what the analysts are thinking? Take a look at our interactive list of analysts' top stock picks to find out what they feel might have an attractive future outlook!
PS. The Simply Wall St app conducts a discounted cash flow valuation for every stock on the WSE every day. If you want to find the calculation for other stocks just search here.
If you're looking to trade Fabryka Konstrukcji Drewnianych, open an account with the lowest-cost platform trusted by professionals, Interactive Brokers.
With clients in over 200 countries and territories, and access to 160 markets, IBKR lets you trade stocks, options, futures, forex, bonds and funds from a single integrated account.
Enjoy no hidden fees, no account minimums, and FX conversion rates as low as 0.03%, far better than what most brokers offer.
Sponsored ContentNew: AI Stock Screener & Alerts
Our new AI Stock Screener scans the market every day to uncover opportunities.
• Dividend Powerhouses (3%+ Yield)
• Undervalued Small Caps with Insider Buying
• High growth Tech and AI Companies
Or build your own from over 50 metrics.
Have feedback on this article? Concerned about the content? Get in touch with us directly. Alternatively, email editorial-team (at) simplywallst.com.
This article by Simply Wall St is general in nature. We provide commentary based on historical data and analyst forecasts only using an unbiased methodology and our articles are not intended to be financial advice. It does not constitute a recommendation to buy or sell any stock, and does not take account of your objectives, or your financial situation. We aim to bring you long-term focused analysis driven by fundamental data. Note that our analysis may not factor in the latest price-sensitive company announcements or qualitative material. Simply Wall St has no position in any stocks mentioned.
About WSE:FKD
Fabryka Konstrukcji Drewnianych
Manufactures and sells wooden structures and architectural components in Poland and internationally.
Slight and fair value.
Market Insights

Community Narratives

