
Advertisement
- New Zealand
- /
- Software
- /
- NZSE:VGL
Revenues Not Telling The Story For Vista Group International Limited (NZSE:VGL) After Shares Rise 25%
Despite an already strong run, Vista Group International Limited (NZSE:VGL) shares have been powering on, with a gain of 25% in the last thirty days. The last 30 days bring the annual gain to a very sharp 57%.
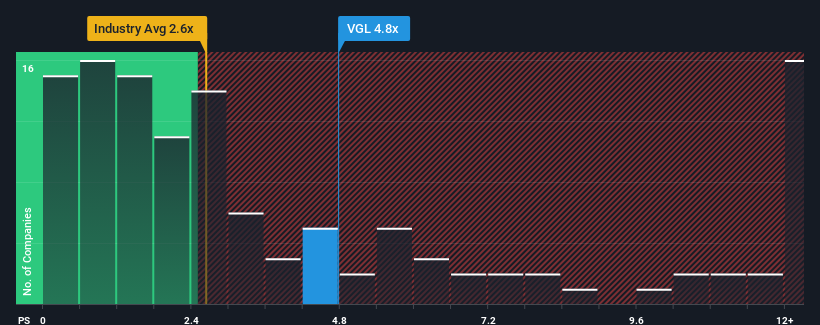
Even after such a large jump in price, you could still be forgiven for feeling indifferent about Vista Group International's P/S ratio of 4.8x, since the median price-to-sales (or "P/S") ratio for the Software industry in New Zealand is also close to 5.1x. Although, it's not wise to simply ignore the P/S without explanation as investors may be disregarding a distinct opportunity or a costly mistake.
View our latest analysis for Vista Group International
What Does Vista Group International's P/S Mean For Shareholders?
Recent times haven't been great for Vista Group International as its revenue has been rising slower than most other companies. It might be that many expect the uninspiring revenue performance to strengthen positively, which has kept the P/S ratio from falling. You'd really hope so, otherwise you're paying a relatively elevated price for a company with this sort of growth profile.
Want the full picture on analyst estimates for the company? Then our free report on Vista Group International will help you uncover what's on the horizon.What Are Revenue Growth Metrics Telling Us About The P/S?
The only time you'd be comfortable seeing a P/S like Vista Group International's is when the company's growth is tracking the industry closely.
Retrospectively, the last year delivered virtually the same number to the company's top line as the year before. Although pleasingly revenue has lifted 63% in aggregate from three years ago, notwithstanding the last 12 months. Therefore, it's fair to say the revenue growth recently has been great for the company, but investors will want to ask why it has slowed to such an extent.
Turning to the outlook, the next three years should generate growth of 14% per year as estimated by the five analysts watching the company. That's shaping up to be materially lower than the 20% each year growth forecast for the broader industry.
With this information, we find it interesting that Vista Group International is trading at a fairly similar P/S compared to the industry. Apparently many investors in the company are less bearish than analysts indicate and aren't willing to let go of their stock right now. Maintaining these prices will be difficult to achieve as this level of revenue growth is likely to weigh down the shares eventually.
The Final Word
Vista Group International appears to be back in favour with a solid price jump bringing its P/S back in line with other companies in the industry Typically, we'd caution against reading too much into price-to-sales ratios when settling on investment decisions, though it can reveal plenty about what other market participants think about the company.
When you consider that Vista Group International's revenue growth estimates are fairly muted compared to the broader industry, it's easy to see why we consider it unexpected to be trading at its current P/S ratio. At present, we aren't confident in the P/S as the predicted future revenues aren't likely to support a more positive sentiment for long. Circumstances like this present a risk to current and prospective investors who may see share prices fall if the low revenue growth impacts the sentiment.
The company's balance sheet is another key area for risk analysis. Our free balance sheet analysis for Vista Group International with six simple checks will allow you to discover any risks that could be an issue.
If these risks are making you reconsider your opinion on Vista Group International, explore our interactive list of high quality stocks to get an idea of what else is out there.
New: Manage All Your Stock Portfolios in One Place
We've created the ultimate portfolio companion for stock investors, and it's free.
• Connect an unlimited number of Portfolios and see your total in one currency
• Be alerted to new Warning Signs or Risks via email or mobile
• Track the Fair Value of your stocks
Have feedback on this article? Concerned about the content? Get in touch with us directly. Alternatively, email editorial-team (at) simplywallst.com.
This article by Simply Wall St is general in nature. We provide commentary based on historical data and analyst forecasts only using an unbiased methodology and our articles are not intended to be financial advice. It does not constitute a recommendation to buy or sell any stock, and does not take account of your objectives, or your financial situation. We aim to bring you long-term focused analysis driven by fundamental data. Note that our analysis may not factor in the latest price-sensitive company announcements or qualitative material. Simply Wall St has no position in any stocks mentioned.
About NZSE:VGL
Vista Group International
Provides software and data analytics solutions to the film industry.
Excellent balance sheet with reasonable growth potential.
Market Insights

Advertisement
Community Narratives
The Next Phase of Energy Storage: How NeoVolta Is Tackling America’s Power Crunch
Fair Value US$7.50|35.1% undervalued
MA
Community Contributor
Why EnSilica is Worth Possibly 13x its Current Price
Fair Value UK£5.00|89.8% undervalued
DO
Community Contributor
M&A Activity, Industry Diversification & A Defense Contract Monopoly Will Push BWXT For Healthy Long-Term Growth
Fair Value US$220.00|15.2% undervalued
CL
Community Contributor
A case for Cassiar Gold Corp (TSXV: GLDC) to reach CAD$8-10 before 2030 (X30-37)
Fair Value CA$10.00|96.0% undervalued
AG
Community Contributor