
Advertisement
- New Zealand
- /
- Hospitality
- /
- NZSE:RBD
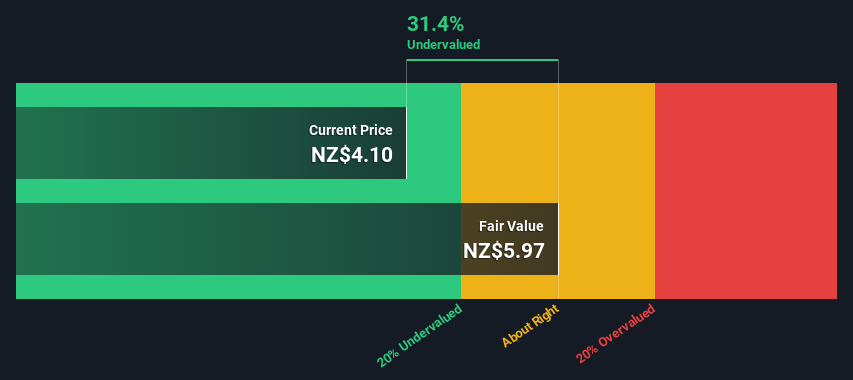
An Intrinsic Calculation For Restaurant Brands New Zealand Limited (NZSE:RBD) Suggests It's 31% Undervalued
Key Insights
- Using the 2 Stage Free Cash Flow to Equity, Restaurant Brands New Zealand fair value estimate is NZ$5.97
- Restaurant Brands New Zealand's NZ$4.10 share price signals that it might be 31% undervalued
- The NZ$5.64 analyst price target for RBD is 5.5% less than our estimate of fair value
Today we'll do a simple run through of a valuation method used to estimate the attractiveness of Restaurant Brands New Zealand Limited (NZSE:RBD) as an investment opportunity by taking the expected future cash flows and discounting them to today's value. Our analysis will employ the Discounted Cash Flow (DCF) model. It may sound complicated, but actually it is quite simple!
We generally believe that a company's value is the present value of all of the cash it will generate in the future. However, a DCF is just one valuation metric among many, and it is not without flaws. Anyone interested in learning a bit more about intrinsic value should have a read of the Simply Wall St analysis model.
Check out our latest analysis for Restaurant Brands New Zealand
The Method
We are going to use a two-stage DCF model, which, as the name states, takes into account two stages of growth. The first stage is generally a higher growth period which levels off heading towards the terminal value, captured in the second 'steady growth' period. To start off with, we need to estimate the next ten years of cash flows. Where possible we use analyst estimates, but when these aren't available we extrapolate the previous free cash flow (FCF) from the last estimate or reported value. We assume companies with shrinking free cash flow will slow their rate of shrinkage, and that companies with growing free cash flow will see their growth rate slow, over this period. We do this to reflect that growth tends to slow more in the early years than it does in later years.
A DCF is all about the idea that a dollar in the future is less valuable than a dollar today, and so the sum of these future cash flows is then discounted to today's value:
10-year free cash flow (FCF) estimate
| 2024 | 2025 | 2026 | 2027 | 2028 | 2029 | 2030 | 2031 | 2032 | 2033 | |
| Levered FCF (NZ$, Millions) | NZ$50.6m | NZ$61.3m | NZ$69.3m | NZ$76.1m | NZ$82.0m | NZ$86.9m | NZ$91.3m | NZ$95.1m | NZ$98.6m | NZ$101.9m |
| Growth Rate Estimate Source | Analyst x1 | Analyst x1 | Est @ 13.05% | Est @ 9.87% | Est @ 7.63% | Est @ 6.07% | Est @ 4.98% | Est @ 4.22% | Est @ 3.68% | Est @ 3.30% |
| Present Value (NZ$, Millions) Discounted @ 12% | NZ$45.0 | NZ$48.5 | NZ$48.8 | NZ$47.7 | NZ$45.6 | NZ$43.0 | NZ$40.2 | NZ$37.3 | NZ$34.4 | NZ$31.6 |
("Est" = FCF growth rate estimated by Simply Wall St)
Present Value of 10-year Cash Flow (PVCF) = NZ$422m
The second stage is also known as Terminal Value, this is the business's cash flow after the first stage. The Gordon Growth formula is used to calculate Terminal Value at a future annual growth rate equal to the 5-year average of the 10-year government bond yield of 2.4%. We discount the terminal cash flows to today's value at a cost of equity of 12%.
Terminal Value (TV)= FCF2033 × (1 + g) ÷ (r – g) = NZ$102m× (1 + 2.4%) ÷ (12%– 2.4%) = NZ$1.0b
Present Value of Terminal Value (PVTV)= TV / (1 + r)10= NZ$1.0b÷ ( 1 + 12%)10= NZ$323m
The total value is the sum of cash flows for the next ten years plus the discounted terminal value, which results in the Total Equity Value, which in this case is NZ$745m. In the final step we divide the equity value by the number of shares outstanding. Relative to the current share price of NZ$4.1, the company appears quite undervalued at a 31% discount to where the stock price trades currently. Valuations are imprecise instruments though, rather like a telescope - move a few degrees and end up in a different galaxy. Do keep this in mind.
The Assumptions
Now the most important inputs to a discounted cash flow are the discount rate, and of course, the actual cash flows. If you don't agree with these result, have a go at the calculation yourself and play with the assumptions. The DCF also does not consider the possible cyclicality of an industry, or a company's future capital requirements, so it does not give a full picture of a company's potential performance. Given that we are looking at Restaurant Brands New Zealand as potential shareholders, the cost of equity is used as the discount rate, rather than the cost of capital (or weighted average cost of capital, WACC) which accounts for debt. In this calculation we've used 12%, which is based on a levered beta of 2.000. Beta is a measure of a stock's volatility, compared to the market as a whole. We get our beta from the industry average beta of globally comparable companies, with an imposed limit between 0.8 and 2.0, which is a reasonable range for a stable business.
SWOT Analysis for Restaurant Brands New Zealand
Strength
- Debt is well covered by cash flow.
Weakness
- Earnings declined over the past year.
- Interest payments on debt are not well covered.
- Dividend is low compared to the top 25% of dividend payers in the Hospitality market.
Opportunity
- Annual earnings are forecast to grow faster than the New Zealander market.
- Trading below our estimate of fair value by more than 20%.
Threat
- Dividends are not covered by earnings.
- Annual revenue is forecast to grow slower than the New Zealander market.
Looking Ahead:
Although the valuation of a company is important, it ideally won't be the sole piece of analysis you scrutinize for a company. DCF models are not the be-all and end-all of investment valuation. Instead the best use for a DCF model is to test certain assumptions and theories to see if they would lead to the company being undervalued or overvalued. For example, changes in the company's cost of equity or the risk free rate can significantly impact the valuation. What is the reason for the share price sitting below the intrinsic value? For Restaurant Brands New Zealand, we've compiled three pertinent elements you should consider:
- Risks: Consider for instance, the ever-present spectre of investment risk. We've identified 4 warning signs with Restaurant Brands New Zealand (at least 1 which is a bit unpleasant) , and understanding them should be part of your investment process.
- Future Earnings: How does RBD's growth rate compare to its peers and the wider market? Dig deeper into the analyst consensus number for the upcoming years by interacting with our free analyst growth expectation chart.
- Other Solid Businesses: Low debt, high returns on equity and good past performance are fundamental to a strong business. Why not explore our interactive list of stocks with solid business fundamentals to see if there are other companies you may not have considered!
PS. Simply Wall St updates its DCF calculation for every New Zealander stock every day, so if you want to find the intrinsic value of any other stock just search here.
New: AI Stock Screener & Alerts
Our new AI Stock Screener scans the market every day to uncover opportunities.
• Dividend Powerhouses (3%+ Yield)
• Undervalued Small Caps with Insider Buying
• High growth Tech and AI Companies
Or build your own from over 50 metrics.
Have feedback on this article? Concerned about the content? Get in touch with us directly. Alternatively, email editorial-team (at) simplywallst.com.
This article by Simply Wall St is general in nature. We provide commentary based on historical data and analyst forecasts only using an unbiased methodology and our articles are not intended to be financial advice. It does not constitute a recommendation to buy or sell any stock, and does not take account of your objectives, or your financial situation. We aim to bring you long-term focused analysis driven by fundamental data. Note that our analysis may not factor in the latest price-sensitive company announcements or qualitative material. Simply Wall St has no position in any stocks mentioned.
About NZSE:RBD
Restaurant Brands New Zealand
Operates quick service and takeaway restaurants in New Zealand, Australia, California, Hawaii, Saipan, and Guam.
Good value with proven track record.
Market Insights

Advertisement
Community Narratives
Groundbreaking therapies that could change the treatment landscape for PTSD, fibromyalgia, MS & Alzheimer’s
Fair Value US$6.20|86.9% undervalued
CM
Community Contributor
DigitalOcean Will Grow 14% by Embracing AI with Paperspace Acquisition
Fair Value US$50.00|41.7% undervalued
NE
Community Contributor
Viant Technology: A Rising AdTech Challenger in the AI-Powered CTV Market
Fair Value US$38.61|63.2% undervalued
BL
Community Contributor
Volvo will Accelerate Forward into Electric and Autonomous Leadership in Five Years
Fair Value SEK 438.80|39.7% undervalued
UN
Community Contributor