
Advertisement
- New Zealand
- /
- Building
- /
- NZSE:FBU
Investors in Fletcher Building (NZSE:FBU) have unfortunately lost 26% over the last three years

Many investors define successful investing as beating the market average over the long term. But its virtually certain that sometimes you will buy stocks that fall short of the market average returns. We regret to report that long term Fletcher Building Limited (NZSE:FBU) shareholders have had that experience, with the share price dropping 39% in three years, versus a market decline of about 5.4%.
Now let's have a look at the company's fundamentals, and see if the long term shareholder return has matched the performance of the underlying business.
Check out our latest analysis for Fletcher Building
To quote Buffett, 'Ships will sail around the world but the Flat Earth Society will flourish. There will continue to be wide discrepancies between price and value in the marketplace...' One way to examine how market sentiment has changed over time is to look at the interaction between a company's share price and its earnings per share (EPS).
During five years of share price growth, Fletcher Building moved from a loss to profitability. We would usually expect to see the share price rise as a result. So it's worth looking at other metrics to try to understand the share price move.
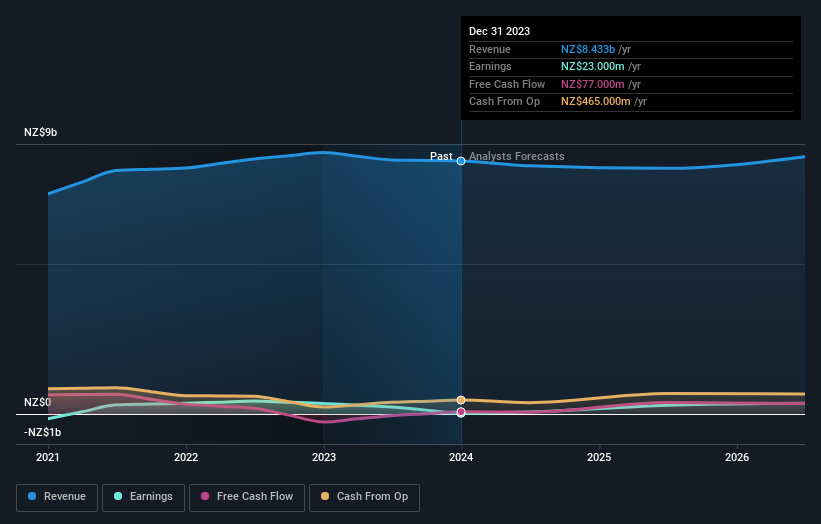
We note that, in three years, revenue has actually grown at a 3.8% annual rate, so that doesn't seem to be a reason to sell shares. This analysis is just perfunctory, but it might be worth researching Fletcher Building more closely, as sometimes stocks fall unfairly. This could present an opportunity.
The company's revenue and earnings (over time) are depicted in the image below (click to see the exact numbers).
We like that insiders have been buying shares in the last twelve months. Even so, future earnings will be far more important to whether current shareholders make money. If you are thinking of buying or selling Fletcher Building stock, you should check out this free report showing analyst profit forecasts.
What About The Total Shareholder Return (TSR)?
We've already covered Fletcher Building's share price action, but we should also mention its total shareholder return (TSR). Arguably the TSR is a more complete return calculation because it accounts for the value of dividends (as if they were reinvested), along with the hypothetical value of any discounted capital that have been offered to shareholders. Fletcher Building's TSR of was a loss of 26% for the 3 years. That wasn't as bad as its share price return, because it has paid dividends.
A Different Perspective
It's nice to see that Fletcher Building shareholders have received a total shareholder return of 1.5% over the last year. Having said that, the five-year TSR of 4% a year, is even better. Potential buyers might understandably feel they've missed the opportunity, but it's always possible business is still firing on all cylinders. I find it very interesting to look at share price over the long term as a proxy for business performance. But to truly gain insight, we need to consider other information, too. Case in point: We've spotted 4 warning signs for Fletcher Building you should be aware of.
There are plenty of other companies that have insiders buying up shares. You probably do not want to miss this free list of growing companies that insiders are buying.
Please note, the market returns quoted in this article reflect the market weighted average returns of stocks that currently trade on New Zealander exchanges.
New: AI Stock Screener & Alerts
Our new AI Stock Screener scans the market every day to uncover opportunities.
• Dividend Powerhouses (3%+ Yield)
• Undervalued Small Caps with Insider Buying
• High growth Tech and AI Companies
Or build your own from over 50 metrics.
Have feedback on this article? Concerned about the content? Get in touch with us directly. Alternatively, email editorial-team (at) simplywallst.com.
This article by Simply Wall St is general in nature. We provide commentary based on historical data and analyst forecasts only using an unbiased methodology and our articles are not intended to be financial advice. It does not constitute a recommendation to buy or sell any stock, and does not take account of your objectives, or your financial situation. We aim to bring you long-term focused analysis driven by fundamental data. Note that our analysis may not factor in the latest price-sensitive company announcements or qualitative material. Simply Wall St has no position in any stocks mentioned.
About NZSE:FBU
Fletcher Building
Engages in the manufacture and distribution of building products in New Zealand, Australia, and internationally.
Undervalued with adequate balance sheet.
Similar Companies
Market Insights

Advertisement
Community Narratives
Groundbreaking therapies that could change the treatment landscape for PTSD, fibromyalgia, MS & Alzheimer’s
Fair Value US$6.20|86.9% undervalued
CM
Community Contributor
DigitalOcean Will Grow 14% by Embracing AI with Paperspace Acquisition
Fair Value US$50.00|40.2% undervalued
NE
Community Contributor
Viant Technology: A Rising AdTech Challenger in the AI-Powered CTV Market
Fair Value US$38.61|62.7% undervalued
BL
Community Contributor
Volvo will Accelerate Forward into Electric and Autonomous Leadership in Five Years
Fair Value SEK 438.80|39.7% undervalued
UN
Community Contributor