- New Zealand
- /
- Building
- /
- NZSE:FBU
Fletcher Building Limited's (NZSE:FBU) Stock Has Fared Decently: Is the Market Following Strong Financials?


Fletcher Building's (NZSE:FBU) stock is up by 4.9% over the past month. Given that the market rewards strong financials in the long-term, we wonder if that is the case in this instance. Particularly, we will be paying attention to Fletcher Building's ROE today.
Return on Equity or ROE is a test of how effectively a company is growing its value and managing investors’ money. Put another way, it reveals the company's success at turning shareholder investments into profits.
Check out our latest analysis for Fletcher Building
How To Calculate Return On Equity?
The formula for ROE is:
Return on Equity = Net Profit (from continuing operations) ÷ Shareholders' Equity
So, based on the above formula, the ROE for Fletcher Building is:
12% = NZ$439m ÷ NZ$3.8b (Based on the trailing twelve months to June 2022).
The 'return' refers to a company's earnings over the last year. One way to conceptualize this is that for each NZ$1 of shareholders' capital it has, the company made NZ$0.12 in profit.
Why Is ROE Important For Earnings Growth?
We have already established that ROE serves as an efficient profit-generating gauge for a company's future earnings. Based on how much of its profits the company chooses to reinvest or "retain", we are then able to evaluate a company's future ability to generate profits. Assuming all else is equal, companies that have both a higher return on equity and higher profit retention are usually the ones that have a higher growth rate when compared to companies that don't have the same features.
Fletcher Building's Earnings Growth And 12% ROE
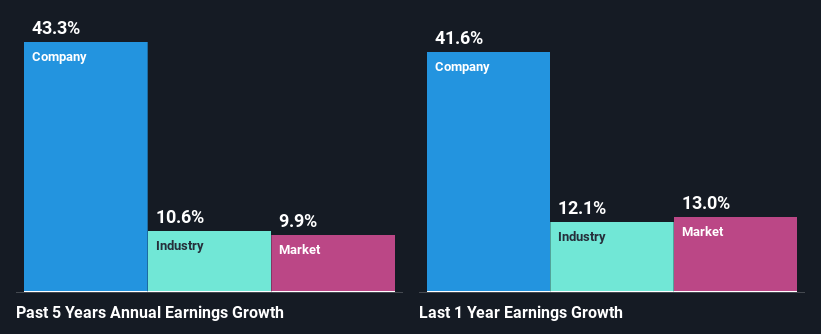
To start with, Fletcher Building's ROE looks acceptable. Further, the company's ROE is similar to the industry average of 12%. This probably goes some way in explaining Fletcher Building's significant 43% net income growth over the past five years amongst other factors. However, there could also be other drivers behind this growth. For example, it is possible that the company's management has made some good strategic decisions, or that the company has a low payout ratio.
We then compared Fletcher Building's net income growth with the industry and we're pleased to see that the company's growth figure is higher when compared with the industry which has a growth rate of 11% in the same period.
Earnings growth is a huge factor in stock valuation. It’s important for an investor to know whether the market has priced in the company's expected earnings growth (or decline). Doing so will help them establish if the stock's future looks promising or ominous. Is Fletcher Building fairly valued compared to other companies? These 3 valuation measures might help you decide.
Is Fletcher Building Efficiently Re-investing Its Profits?
Fletcher Building has a significant three-year median payout ratio of 77%, meaning the company only retains 23% of its income. This implies that the company has been able to achieve high earnings growth despite returning most of its profits to shareholders.
Additionally, Fletcher Building has paid dividends over a period of at least ten years which means that the company is pretty serious about sharing its profits with shareholders. Our latest analyst data shows that the future payout ratio of the company over the next three years is expected to be approximately 71%. As a result, Fletcher Building's ROE is not expected to change by much either, which we inferred from the analyst estimate of 11% for future ROE.
Summary
On the whole, we feel that Fletcher Building's performance has been quite good. In particular, its high ROE is quite noteworthy and also the probable explanation behind its considerable earnings growth. Yet, the company is retaining a small portion of its profits. Which means that the company has been able to grow its earnings in spite of it, so that's not too bad. Having said that, the company's earnings growth is expected to slow down, as forecasted in the current analyst estimates. To know more about the latest analysts predictions for the company, check out this visualization of analyst forecasts for the company.
If you're looking to trade Fletcher Building, open an account with the lowest-cost platform trusted by professionals, Interactive Brokers.
With clients in over 200 countries and territories, and access to 160 markets, IBKR lets you trade stocks, options, futures, forex, bonds and funds from a single integrated account.
Enjoy no hidden fees, no account minimums, and FX conversion rates as low as 0.03%, far better than what most brokers offer.
Sponsored ContentNew: AI Stock Screener & Alerts
Our new AI Stock Screener scans the market every day to uncover opportunities.
• Dividend Powerhouses (3%+ Yield)
• Undervalued Small Caps with Insider Buying
• High growth Tech and AI Companies
Or build your own from over 50 metrics.
Have feedback on this article? Concerned about the content? Get in touch with us directly. Alternatively, email editorial-team (at) simplywallst.com.
This article by Simply Wall St is general in nature. We provide commentary based on historical data and analyst forecasts only using an unbiased methodology and our articles are not intended to be financial advice. It does not constitute a recommendation to buy or sell any stock, and does not take account of your objectives, or your financial situation. We aim to bring you long-term focused analysis driven by fundamental data. Note that our analysis may not factor in the latest price-sensitive company announcements or qualitative material. Simply Wall St has no position in any stocks mentioned.
About NZSE:FBU
Fletcher Building
Engages in the manufacture and distribution of building products in New Zealand, Australia, and internationally.
Undervalued with adequate balance sheet.
Similar Companies
Market Insights

Community Narratives

