
Advertisement

Some say volatility, rather than debt, is the best way to think about risk as an investor, but Warren Buffett famously said that 'Volatility is far from synonymous with risk.' When we think about how risky a company is, we always like to look at its use of debt, since debt overload can lead to ruin. Importantly, Odfjell SE (OB:ODF) does carry debt. But the real question is whether this debt is making the company risky.
What Risk Does Debt Bring?
Debt is a tool to help businesses grow, but if a business is incapable of paying off its lenders, then it exists at their mercy. In the worst case scenario, a company can go bankrupt if it cannot pay its creditors. However, a more usual (but still expensive) situation is where a company must dilute shareholders at a cheap share price simply to get debt under control. Of course, the upside of debt is that it often represents cheap capital, especially when it replaces dilution in a company with the ability to reinvest at high rates of return. When we think about a company's use of debt, we first look at cash and debt together.
View our latest analysis for Odfjell
How Much Debt Does Odfjell Carry?
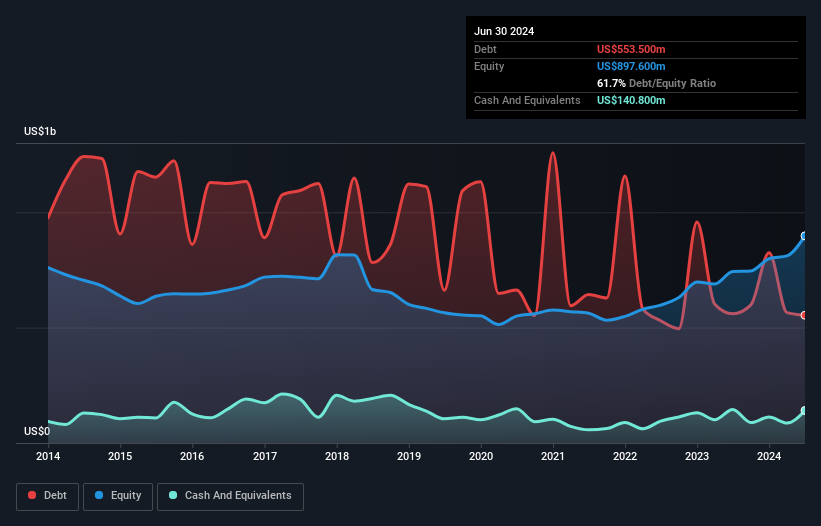
The chart below, which you can click on for greater detail, shows that Odfjell had US$553.5m in debt in June 2024; about the same as the year before. On the flip side, it has US$140.8m in cash leading to net debt of about US$412.7m.
How Healthy Is Odfjell's Balance Sheet?
According to the last reported balance sheet, Odfjell had liabilities of US$363.1m due within 12 months, and liabilities of US$812.7m due beyond 12 months. On the other hand, it had cash of US$140.8m and US$144.8m worth of receivables due within a year. So it has liabilities totalling US$890.2m more than its cash and near-term receivables, combined.
This is a mountain of leverage relative to its market capitalization of US$993.5m. This suggests shareholders would be heavily diluted if the company needed to shore up its balance sheet in a hurry.
We use two main ratios to inform us about debt levels relative to earnings. The first is net debt divided by earnings before interest, tax, depreciation, and amortization (EBITDA), while the second is how many times its earnings before interest and tax (EBIT) covers its interest expense (or its interest cover, for short). Thus we consider debt relative to earnings both with and without depreciation and amortization expenses.
While Odfjell's low debt to EBITDA ratio of 0.98 suggests only modest use of debt, the fact that EBIT only covered the interest expense by 4.0 times last year does give us pause. So we'd recommend keeping a close eye on the impact financing costs are having on the business. If Odfjell can keep growing EBIT at last year's rate of 18% over the last year, then it will find its debt load easier to manage. When analysing debt levels, the balance sheet is the obvious place to start. But ultimately the future profitability of the business will decide if Odfjell can strengthen its balance sheet over time. So if you're focused on the future you can check out this free report showing analyst profit forecasts.
But our final consideration is also important, because a company cannot pay debt with paper profits; it needs cold hard cash. So we always check how much of that EBIT is translated into free cash flow. Over the last three years, Odfjell actually produced more free cash flow than EBIT. That sort of strong cash conversion gets us as excited as the crowd when the beat drops at a Daft Punk concert.
Our View
On our analysis Odfjell's conversion of EBIT to free cash flow should signal that it won't have too much trouble with its debt. But the other factors we noted above weren't so encouraging. For instance it seems like it has to struggle a bit to handle its total liabilities. When we consider all the elements mentioned above, it seems to us that Odfjell is managing its debt quite well. Having said that, the load is sufficiently heavy that we would recommend any shareholders keep a close eye on it. When analysing debt levels, the balance sheet is the obvious place to start. However, not all investment risk resides within the balance sheet - far from it. These risks can be hard to spot. Every company has them, and we've spotted 2 warning signs for Odfjell you should know about.
At the end of the day, it's often better to focus on companies that are free from net debt. You can access our special list of such companies (all with a track record of profit growth). It's free.
New: AI Stock Screener & Alerts
Our new AI Stock Screener scans the market every day to uncover opportunities.
• Dividend Powerhouses (3%+ Yield)
• Undervalued Small Caps with Insider Buying
• High growth Tech and AI Companies
Or build your own from over 50 metrics.
Have feedback on this article? Concerned about the content? Get in touch with us directly. Alternatively, email editorial-team (at) simplywallst.com.
This article by Simply Wall St is general in nature. We provide commentary based on historical data and analyst forecasts only using an unbiased methodology and our articles are not intended to be financial advice. It does not constitute a recommendation to buy or sell any stock, and does not take account of your objectives, or your financial situation. We aim to bring you long-term focused analysis driven by fundamental data. Note that our analysis may not factor in the latest price-sensitive company announcements or qualitative material. Simply Wall St has no position in any stocks mentioned.
About OB:ODF
Odfjell
Provides services for the transportation and storage of bulk liquid chemicals, acids, edible oils, and other specialty products in North America, South America, Norway, the Netherlands, rest of Europe, the Middle East, Asia, Africa, and Australasia.
Very undervalued with solid track record and pays a dividend.
Similar Companies
Market Insights

Advertisement
Community Narratives

BMW cruising ahead with new EVs and premium models to boost revenue 5%
Fair Value €135.07|44.5% undervalued
UN
Community Contributor
EU#2 - From Humble Beginnings to Global Powerhouse
Fair Value DKK 851.04|46.1% undervalued
TO
Community Contributor