Telenor ASA (OB:TEL) Shares Could Be 45% Below Their Intrinsic Value Estimate


Key Insights
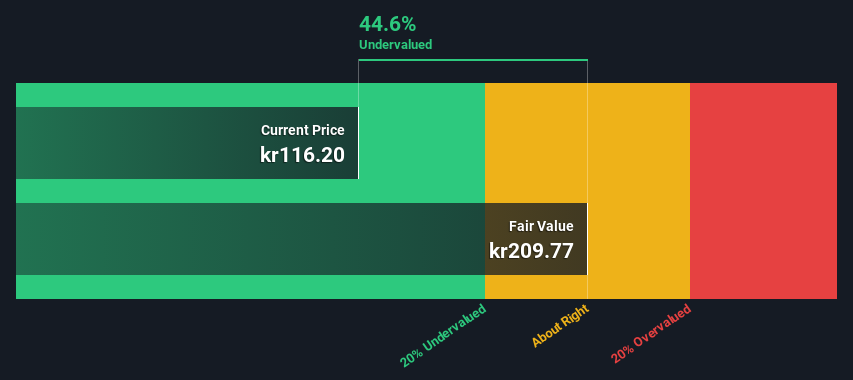
- Using the 2 Stage Free Cash Flow to Equity, Telenor fair value estimate is kr210
- Telenor's kr116 share price signals that it might be 45% undervalued
- Analyst price target for TEL is kr132 which is 37% below our fair value estimate
Today we'll do a simple run through of a valuation method used to estimate the attractiveness of Telenor ASA (OB:TEL) as an investment opportunity by taking the expected future cash flows and discounting them to today's value. Our analysis will employ the Discounted Cash Flow (DCF) model. There's really not all that much to it, even though it might appear quite complex.
We would caution that there are many ways of valuing a company and, like the DCF, each technique has advantages and disadvantages in certain scenarios. For those who are keen learners of equity analysis, the Simply Wall St analysis model here may be something of interest to you.
Check out our latest analysis for Telenor
The Calculation
We use what is known as a 2-stage model, which simply means we have two different periods of growth rates for the company's cash flows. Generally the first stage is higher growth, and the second stage is a lower growth phase. In the first stage we need to estimate the cash flows to the business over the next ten years. Where possible we use analyst estimates, but when these aren't available we extrapolate the previous free cash flow (FCF) from the last estimate or reported value. We assume companies with shrinking free cash flow will slow their rate of shrinkage, and that companies with growing free cash flow will see their growth rate slow, over this period. We do this to reflect that growth tends to slow more in the early years than it does in later years.
A DCF is all about the idea that a dollar in the future is less valuable than a dollar today, so we discount the value of these future cash flows to their estimated value in today's dollars:
10-year free cash flow (FCF) forecast
| 2024 | 2025 | 2026 | 2027 | 2028 | 2029 | 2030 | 2031 | 2032 | 2033 | |
| Levered FCF (NOK, Millions) | kr12.0b | kr13.1b | kr12.1b | kr11.9b | kr11.9b | kr11.9b | kr12.0b | kr12.2b | kr12.3b | kr12.6b |
| Growth Rate Estimate Source | Analyst x6 | Analyst x6 | Analyst x4 | Est @ -1.29% | Est @ -0.29% | Est @ 0.41% | Est @ 0.90% | Est @ 1.24% | Est @ 1.48% | Est @ 1.65% |
| Present Value (NOK, Millions) Discounted @ 5.7% | kr11.3k | kr11.7k | kr10.2k | kr9.5k | kr9.0k | kr8.5k | kr8.1k | kr7.8k | kr7.5k | kr7.2k |
("Est" = FCF growth rate estimated by Simply Wall St)
Present Value of 10-year Cash Flow (PVCF) = kr91b
The second stage is also known as Terminal Value, this is the business's cash flow after the first stage. For a number of reasons a very conservative growth rate is used that cannot exceed that of a country's GDP growth. In this case we have used the 5-year average of the 10-year government bond yield (2.0%) to estimate future growth. In the same way as with the 10-year 'growth' period, we discount future cash flows to today's value, using a cost of equity of 5.7%.
Terminal Value (TV)= FCF2033 × (1 + g) ÷ (r – g) = kr13b× (1 + 2.0%) ÷ (5.7%– 2.0%) = kr348b
Present Value of Terminal Value (PVTV)= TV / (1 + r)10= kr348b÷ ( 1 + 5.7%)10= kr200b
The total value is the sum of cash flows for the next ten years plus the discounted terminal value, which results in the Total Equity Value, which in this case is kr290b. To get the intrinsic value per share, we divide this by the total number of shares outstanding. Compared to the current share price of kr116, the company appears quite undervalued at a 45% discount to where the stock price trades currently. Valuations are imprecise instruments though, rather like a telescope - move a few degrees and end up in a different galaxy. Do keep this in mind.
The Assumptions
We would point out that the most important inputs to a discounted cash flow are the discount rate and of course the actual cash flows. Part of investing is coming up with your own evaluation of a company's future performance, so try the calculation yourself and check your own assumptions. The DCF also does not consider the possible cyclicality of an industry, or a company's future capital requirements, so it does not give a full picture of a company's potential performance. Given that we are looking at Telenor as potential shareholders, the cost of equity is used as the discount rate, rather than the cost of capital (or weighted average cost of capital, WACC) which accounts for debt. In this calculation we've used 5.7%, which is based on a levered beta of 0.800. Beta is a measure of a stock's volatility, compared to the market as a whole. We get our beta from the industry average beta of globally comparable companies, with an imposed limit between 0.8 and 2.0, which is a reasonable range for a stable business.
SWOT Analysis for Telenor
- Debt is well covered by earnings and cashflows.
- Dividend is in the top 25% of dividend payers in the market.
- No major weaknesses identified for TEL.
- Expected to breakeven next year.
- Has sufficient cash runway for more than 3 years based on current free cash flows.
- Trading below our estimate of fair value by more than 20%.
- Dividends are not covered by cash flow.
Moving On:
Whilst important, the DCF calculation shouldn't be the only metric you look at when researching a company. The DCF model is not a perfect stock valuation tool. Instead the best use for a DCF model is to test certain assumptions and theories to see if they would lead to the company being undervalued or overvalued. For example, changes in the company's cost of equity or the risk free rate can significantly impact the valuation. What is the reason for the share price sitting below the intrinsic value? For Telenor, we've put together three additional factors you should consider:
- Risks: We feel that you should assess the 2 warning signs for Telenor (1 doesn't sit too well with us!) we've flagged before making an investment in the company.
- Future Earnings: How does TEL's growth rate compare to its peers and the wider market? Dig deeper into the analyst consensus number for the upcoming years by interacting with our free analyst growth expectation chart.
- Other High Quality Alternatives: Do you like a good all-rounder? Explore our interactive list of high quality stocks to get an idea of what else is out there you may be missing!
PS. The Simply Wall St app conducts a discounted cash flow valuation for every stock on the OB every day. If you want to find the calculation for other stocks just search here.
Valuation is complex, but we're here to simplify it.
Discover if Telenor might be undervalued or overvalued with our detailed analysis, featuring fair value estimates, potential risks, dividends, insider trades, and its financial condition.
Access Free AnalysisHave feedback on this article? Concerned about the content? Get in touch with us directly. Alternatively, email editorial-team (at) simplywallst.com.
This article by Simply Wall St is general in nature. We provide commentary based on historical data and analyst forecasts only using an unbiased methodology and our articles are not intended to be financial advice. It does not constitute a recommendation to buy or sell any stock, and does not take account of your objectives, or your financial situation. We aim to bring you long-term focused analysis driven by fundamental data. Note that our analysis may not factor in the latest price-sensitive company announcements or qualitative material. Simply Wall St has no position in any stocks mentioned.
About OB:TEL
Proven track record average dividend payer.
