Norbit's (OB:NORBT) three-year earnings growth trails the 55% YoY shareholder returns


It might seem bad, but the worst that can happen when you buy a stock (without leverage) is that its share price goes to zero. But in contrast you can make much more than 100% if the company does well. For instance the Norbit ASA (OB:NORBT) share price is 251% higher than it was three years ago. That sort of return is as solid as granite. Also pleasing for shareholders was the 47% gain in the last three months. The company reported its financial results recently; you can catch up on the latest numbers by reading our company report.
Since it's been a strong week for Norbit shareholders, let's have a look at trend of the longer term fundamentals.
See our latest analysis for Norbit
SWOT Analysis for Norbit
- Earnings growth over the past year exceeded the industry.
- Debt is not viewed as a risk.
- Dividend is low compared to the top 25% of dividend payers in the Electronic market.
- Annual earnings are forecast to grow faster than the Norwegian market.
- Good value based on P/E ratio compared to estimated Fair P/E ratio.
- No apparent threats visible for NORBT.
To quote Buffett, 'Ships will sail around the world but the Flat Earth Society will flourish. There will continue to be wide discrepancies between price and value in the marketplace...' One way to examine how market sentiment has changed over time is to look at the interaction between a company's share price and its earnings per share (EPS).
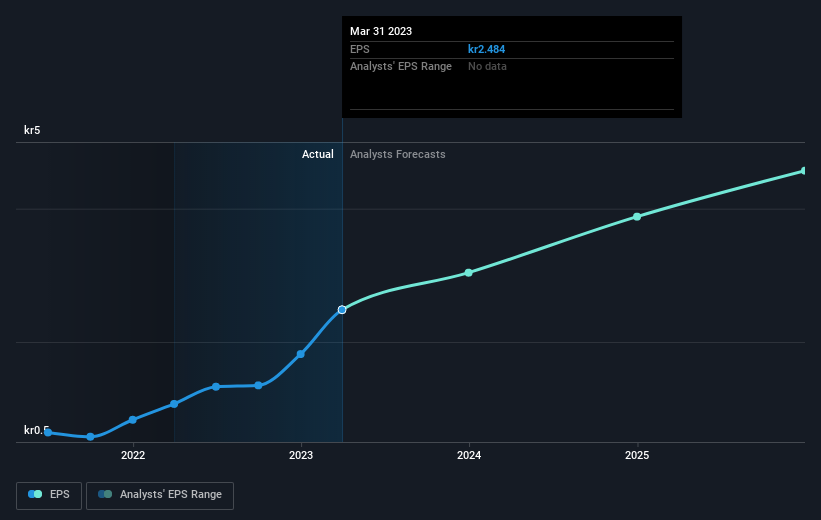
Norbit was able to grow its EPS at 43% per year over three years, sending the share price higher. We note that the 52% yearly (average) share price gain isn't too far from the EPS growth rate. Coincidence? Probably not. That suggests that the market sentiment around the company hasn't changed much over that time. Au contraire, the share price change has arguably mimicked the EPS growth.
The image below shows how EPS has tracked over time (if you click on the image you can see greater detail).
It is of course excellent to see how Norbit has grown profits over the years, but the future is more important for shareholders. You can see how its balance sheet has strengthened (or weakened) over time in this free interactive graphic.
What About Dividends?
As well as measuring the share price return, investors should also consider the total shareholder return (TSR). The TSR is a return calculation that accounts for the value of cash dividends (assuming that any dividend received was reinvested) and the calculated value of any discounted capital raisings and spin-offs. So for companies that pay a generous dividend, the TSR is often a lot higher than the share price return. We note that for Norbit the TSR over the last 3 years was 273%, which is better than the share price return mentioned above. The dividends paid by the company have thusly boosted the total shareholder return.
A Different Perspective
It's nice to see that Norbit shareholders have gained 100% (in total) over the last year. That's including the dividend. That gain actually surpasses the 55% TSR it generated (per year) over three years. The improving returns to shareholders suggests the stock is becoming more popular with time. Most investors take the time to check the data on insider transactions. You can click here to see if insiders have been buying or selling.
For those who like to find winning investments this free list of growing companies with recent insider purchasing, could be just the ticket.
Please note, the market returns quoted in this article reflect the market weighted average returns of stocks that currently trade on Norwegian exchanges.
If you're looking to trade Norbit, open an account with the lowest-cost platform trusted by professionals, Interactive Brokers.
With clients in over 200 countries and territories, and access to 160 markets, IBKR lets you trade stocks, options, futures, forex, bonds and funds from a single integrated account.
Enjoy no hidden fees, no account minimums, and FX conversion rates as low as 0.03%, far better than what most brokers offer.
Sponsored ContentValuation is complex, but we're here to simplify it.
Discover if Norbit might be undervalued or overvalued with our detailed analysis, featuring fair value estimates, potential risks, dividends, insider trades, and its financial condition.
Access Free AnalysisHave feedback on this article? Concerned about the content? Get in touch with us directly. Alternatively, email editorial-team (at) simplywallst.com.
This article by Simply Wall St is general in nature. We provide commentary based on historical data and analyst forecasts only using an unbiased methodology and our articles are not intended to be financial advice. It does not constitute a recommendation to buy or sell any stock, and does not take account of your objectives, or your financial situation. We aim to bring you long-term focused analysis driven by fundamental data. Note that our analysis may not factor in the latest price-sensitive company announcements or qualitative material. Simply Wall St has no position in any stocks mentioned.
About OB:NORBT
Norbit
Provides technology solutions to customers in a range of industries.
Solid track record with excellent balance sheet.
Similar Companies
Market Insights

Community Narratives

