

There's no doubt that money can be made by owning shares of unprofitable businesses. For example, although software-as-a-service business Salesforce.com lost money for years while it grew recurring revenue, if you held shares since 2005, you'd have done very well indeed. Nonetheless, only a fool would ignore the risk that a loss making company burns through its cash too quickly.
Given this risk, we thought we'd take a look at whether BerGenBio (OB:BGBIO) shareholders should be worried about its cash burn. In this report, we will consider the company's annual negative free cash flow, henceforth referring to it as the 'cash burn'. We'll start by comparing its cash burn with its cash reserves in order to calculate its cash runway.
Check out our latest analysis for BerGenBio
When Might BerGenBio Run Out Of Money?
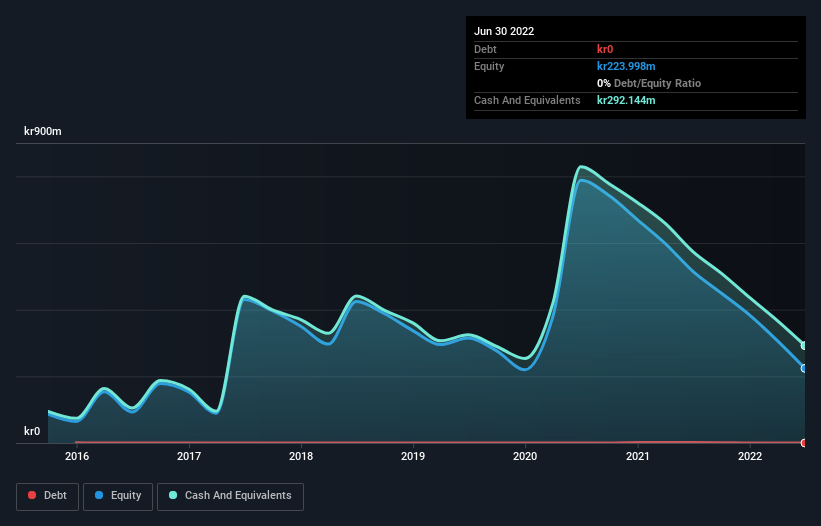
A company's cash runway is the amount of time it would take to burn through its cash reserves at its current cash burn rate. As at June 2022, BerGenBio had cash of kr292m and no debt. Importantly, its cash burn was kr294m over the trailing twelve months. So it had a cash runway of approximately 12 months from June 2022. That's quite a short cash runway, indicating the company must either reduce its annual cash burn or replenish its cash. The image below shows how its cash balance has been changing over the last few years.
How Is BerGenBio's Cash Burn Changing Over Time?
Whilst it's great to see that BerGenBio has already begun generating revenue from operations, last year it only produced kr774k, so we don't think it is generating significant revenue, at this point. As a result, we think it's a bit early to focus on the revenue growth, so we'll limit ourselves to looking at how the cash burn is changing over time. With the cash burn rate up 5.1% in the last year, it seems that the company is ratcheting up investment in the business over time. However, the company's true cash runway will therefore be shorter than suggested above, if spending continues to increase. Clearly, however, the crucial factor is whether the company will grow its business going forward. For that reason, it makes a lot of sense to take a look at our analyst forecasts for the company.
How Easily Can BerGenBio Raise Cash?
While its cash burn is only increasing slightly, BerGenBio shareholders should still consider the potential need for further cash, down the track. Issuing new shares, or taking on debt, are the most common ways for a listed company to raise more money for its business. Commonly, a business will sell new shares in itself to raise cash and drive growth. By comparing a company's annual cash burn to its total market capitalisation, we can estimate roughly how many shares it would have to issue in order to run the company for another year (at the same burn rate).
Since it has a market capitalisation of kr543m, BerGenBio's kr294m in cash burn equates to about 54% of its market value. That's high expenditure relative to the value of the entire company, so if it does have to issue shares to fund more growth, that could end up really hurting shareholders returns (through significant dilution).
How Risky Is BerGenBio's Cash Burn Situation?
We must admit that we don't think BerGenBio is in a very strong position, when it comes to its cash burn. While its cash runway wasn't too bad, its cash burn relative to its market cap does leave us rather nervous. Summing up, we think the BerGenBio's cash burn is a risk, based on the factors we mentioned in this article. On another note, BerGenBio has 6 warning signs (and 3 which shouldn't be ignored) we think you should know about.
Of course, you might find a fantastic investment by looking elsewhere. So take a peek at this free list of interesting companies, and this list of stocks growth stocks (according to analyst forecasts)
Valuation is complex, but we're here to simplify it.
Discover if BerGenBio might be undervalued or overvalued with our detailed analysis, featuring fair value estimates, potential risks, dividends, insider trades, and its financial condition.
Access Free AnalysisHave feedback on this article? Concerned about the content? Get in touch with us directly. Alternatively, email editorial-team (at) simplywallst.com.
This article by Simply Wall St is general in nature. We provide commentary based on historical data and analyst forecasts only using an unbiased methodology and our articles are not intended to be financial advice. It does not constitute a recommendation to buy or sell any stock, and does not take account of your objectives, or your financial situation. We aim to bring you long-term focused analysis driven by fundamental data. Note that our analysis may not factor in the latest price-sensitive company announcements or qualitative material. Simply Wall St has no position in any stocks mentioned.
About OB:BGBIO
BerGenBio
A clinical-stage biopharmaceutical company, engages in the development of medicines to treat drug resistant, metastatic cancers, and respiratory diseases in Norway.
Medium-low with excellent balance sheet.
Market Insights

Community Narratives

