
Advertisement
David Iben put it well when he said, 'Volatility is not a risk we care about. What we care about is avoiding the permanent loss of capital.' It's only natural to consider a company's balance sheet when you examine how risky it is, since debt is often involved when a business collapses. As with many other companies Scana ASA (OB:SCANA) makes use of debt. But should shareholders be worried about its use of debt?
Why Does Debt Bring Risk?
Generally speaking, debt only becomes a real problem when a company can't easily pay it off, either by raising capital or with its own cash flow. Part and parcel of capitalism is the process of 'creative destruction' where failed businesses are mercilessly liquidated by their bankers. While that is not too common, we often do see indebted companies permanently diluting shareholders because lenders force them to raise capital at a distressed price. Of course, plenty of companies use debt to fund growth, without any negative consequences. When we think about a company's use of debt, we first look at cash and debt together.
View our latest analysis for Scana
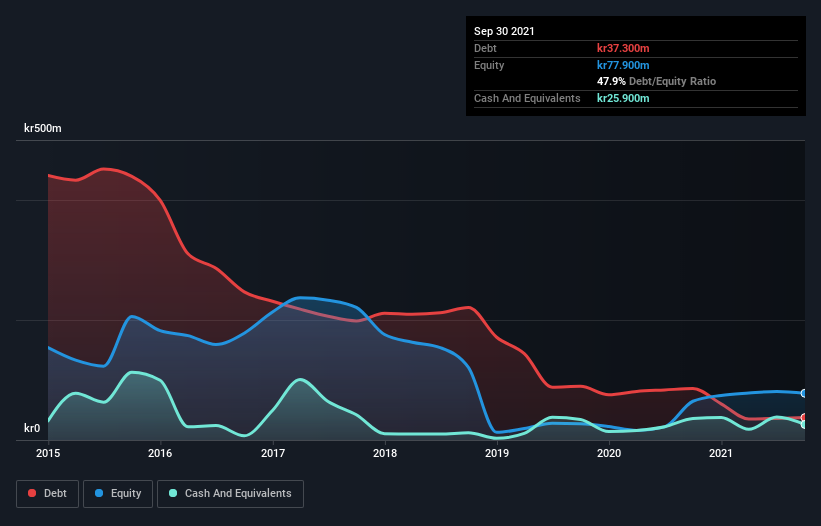
How Much Debt Does Scana Carry?
As you can see below, Scana had kr37.3m of debt at September 2021, down from kr85.8m a year prior. However, it also had kr25.9m in cash, and so its net debt is kr11.4m.
How Healthy Is Scana's Balance Sheet?
The latest balance sheet data shows that Scana had liabilities of kr108.9m due within a year, and liabilities of kr11.3m falling due after that. Offsetting this, it had kr25.9m in cash and kr66.3m in receivables that were due within 12 months. So it has liabilities totalling kr28.0m more than its cash and near-term receivables, combined.
Of course, Scana has a market capitalization of kr167.7m, so these liabilities are probably manageable. But there are sufficient liabilities that we would certainly recommend shareholders continue to monitor the balance sheet, going forward.
We use two main ratios to inform us about debt levels relative to earnings. The first is net debt divided by earnings before interest, tax, depreciation, and amortization (EBITDA), while the second is how many times its earnings before interest and tax (EBIT) covers its interest expense (or its interest cover, for short). This way, we consider both the absolute quantum of the debt, as well as the interest rates paid on it.
Given net debt is only 1.0 times EBITDA, it is initially surprising to see that Scana's EBIT has low interest coverage of 1.3 times. So while we're not necessarily alarmed we think that its debt is far from trivial. Importantly, Scana grew its EBIT by 48% over the last twelve months, and that growth will make it easier to handle its debt. The balance sheet is clearly the area to focus on when you are analysing debt. But it is Scana's earnings that will influence how the balance sheet holds up in the future. So if you're keen to discover more about its earnings, it might be worth checking out this graph of its long term earnings trend.
Finally, while the tax-man may adore accounting profits, lenders only accept cold hard cash. So the logical step is to look at the proportion of that EBIT that is matched by actual free cash flow. Over the last three years, Scana actually produced more free cash flow than EBIT. There's nothing better than incoming cash when it comes to staying in your lenders' good graces.
Our View
Happily, Scana's impressive conversion of EBIT to free cash flow implies it has the upper hand on its debt. But we must concede we find its interest cover has the opposite effect. Looking at the bigger picture, we think Scana's use of debt seems quite reasonable and we're not concerned about it. After all, sensible leverage can boost returns on equity. When analysing debt levels, the balance sheet is the obvious place to start. However, not all investment risk resides within the balance sheet - far from it. We've identified 4 warning signs with Scana (at least 1 which is a bit unpleasant) , and understanding them should be part of your investment process.
At the end of the day, it's often better to focus on companies that are free from net debt. You can access our special list of such companies (all with a track record of profit growth). It's free.
New: Manage All Your Stock Portfolios in One Place
We've created the ultimate portfolio companion for stock investors, and it's free.
• Connect an unlimited number of Portfolios and see your total in one currency
• Be alerted to new Warning Signs or Risks via email or mobile
• Track the Fair Value of your stocks
This article by Simply Wall St is general in nature. We provide commentary based on historical data and analyst forecasts only using an unbiased methodology and our articles are not intended to be financial advice. It does not constitute a recommendation to buy or sell any stock, and does not take account of your objectives, or your financial situation. We aim to bring you long-term focused analysis driven by fundamental data. Note that our analysis may not factor in the latest price-sensitive company announcements or qualitative material. Simply Wall St has no position in any stocks mentioned.
Have feedback on this article? Concerned about the content? Get in touch with us directly. Alternatively, email editorial-team (at) simplywallst.com.
About OB:SCANA
Scana
Provides technology and services for the offshore and energy industries in Norway, other European countries, the United States, Asia, and Africa.
Undervalued with excellent balance sheet.
Market Insights

Advertisement
Community Narratives
A formidable player in AI and enterprise computing.
Fair Value US$210.00|12.2% overvalued
CO
Community Contributor
IREN's Bold Moves in Sustainable Bitcoin Mining & AI Data Centers
Fair Value US$72.52|17.1% undervalued
BL
Community Contributor
Cooling the Champions: The Aussie Tech Behind F1's Victories
Fair Value AU$12.40|38.7% undervalued
TR
Community Contributor