
Advertisement
The external fund manager backed by Berkshire Hathaway's Charlie Munger, Li Lu, makes no bones about it when he says 'The biggest investment risk is not the volatility of prices, but whether you will suffer a permanent loss of capital.' It's only natural to consider a company's balance sheet when you examine how risky it is, since debt is often involved when a business collapses. Importantly, Borregaard ASA (OB:BRG) does carry debt. But should shareholders be worried about its use of debt?
When Is Debt A Problem?
Debt is a tool to help businesses grow, but if a business is incapable of paying off its lenders, then it exists at their mercy. In the worst case scenario, a company can go bankrupt if it cannot pay its creditors. However, a more usual (but still expensive) situation is where a company must dilute shareholders at a cheap share price simply to get debt under control. Of course, the upside of debt is that it often represents cheap capital, especially when it replaces dilution in a company with the ability to reinvest at high rates of return. When we examine debt levels, we first consider both cash and debt levels, together.
How Much Debt Does Borregaard Carry?
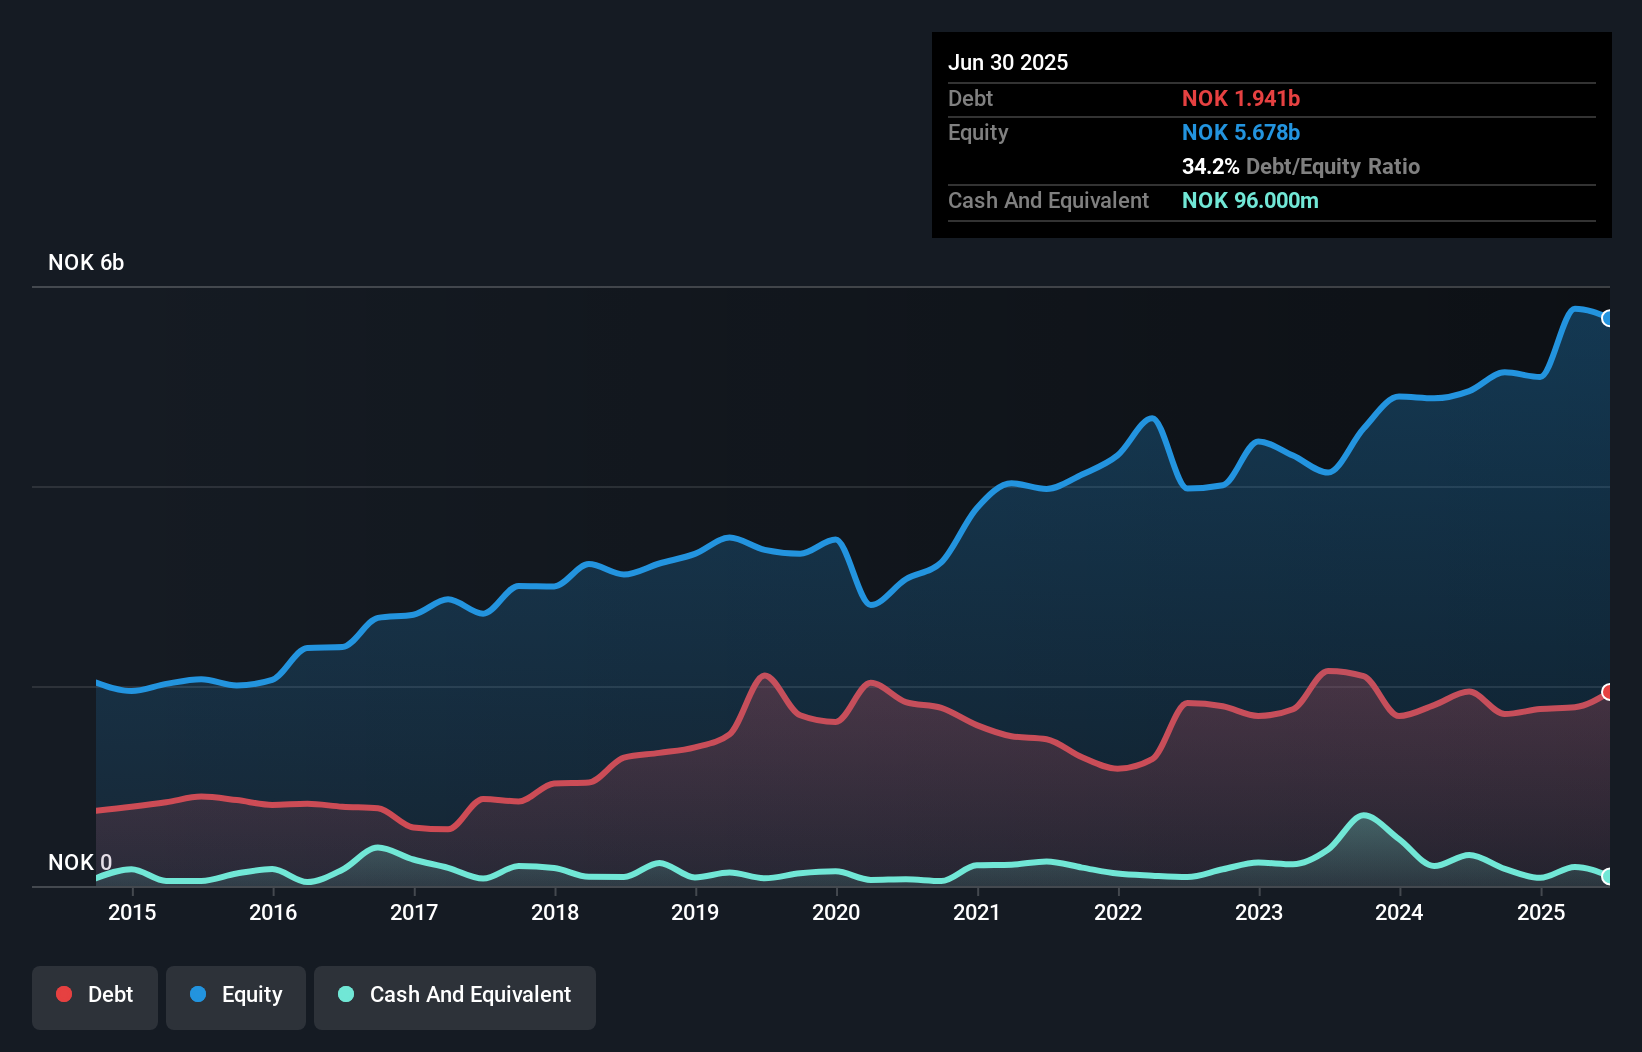
As you can see below, Borregaard had kr1.94b of debt, at June 2025, which is about the same as the year before. You can click the chart for greater detail. On the flip side, it has kr96.0m in cash leading to net debt of about kr1.85b.
A Look At Borregaard's Liabilities
We can see from the most recent balance sheet that Borregaard had liabilities of kr2.02b falling due within a year, and liabilities of kr2.27b due beyond that. On the other hand, it had cash of kr96.0m and kr1.74b worth of receivables due within a year. So its liabilities outweigh the sum of its cash and (near-term) receivables by kr2.45b.
Of course, Borregaard has a market capitalization of kr20.5b, so these liabilities are probably manageable. Having said that, it's clear that we should continue to monitor its balance sheet, lest it change for the worse.
See our latest analysis for Borregaard
We use two main ratios to inform us about debt levels relative to earnings. The first is net debt divided by earnings before interest, tax, depreciation, and amortization (EBITDA), while the second is how many times its earnings before interest and tax (EBIT) covers its interest expense (or its interest cover, for short). This way, we consider both the absolute quantum of the debt, as well as the interest rates paid on it.
Borregaard has net debt of just 1.0 times EBITDA, indicating that it is certainly not a reckless borrower. And this view is supported by the solid interest coverage, with EBIT coming in at 9.1 times the interest expense over the last year. Also good is that Borregaard grew its EBIT at 12% over the last year, further increasing its ability to manage debt. When analysing debt levels, the balance sheet is the obvious place to start. But ultimately the future profitability of the business will decide if Borregaard can strengthen its balance sheet over time. So if you're focused on the future you can check out this free report showing analyst profit forecasts.
Finally, while the tax-man may adore accounting profits, lenders only accept cold hard cash. So it's worth checking how much of that EBIT is backed by free cash flow. In the last three years, Borregaard's free cash flow amounted to 45% of its EBIT, less than we'd expect. That's not great, when it comes to paying down debt.
Our View
The good news is that Borregaard's demonstrated ability to cover its interest expense with its EBIT delights us like a fluffy puppy does a toddler. And its net debt to EBITDA is good too. Looking at all the aforementioned factors together, it strikes us that Borregaard can handle its debt fairly comfortably. On the plus side, this leverage can boost shareholder returns, but the potential downside is more risk of loss, so it's worth monitoring the balance sheet. Above most other metrics, we think its important to track how fast earnings per share is growing, if at all. If you've also come to that realization, you're in luck, because today you can view this interactive graph of Borregaard's earnings per share history for free.
At the end of the day, it's often better to focus on companies that are free from net debt. You can access our special list of such companies (all with a track record of profit growth). It's free.
Valuation is complex, but we're here to simplify it.
Discover if Borregaard might be undervalued or overvalued with our detailed analysis, featuring fair value estimates, potential risks, dividends, insider trades, and its financial condition.
Access Free AnalysisHave feedback on this article? Concerned about the content? Get in touch with us directly. Alternatively, email editorial-team (at) simplywallst.com.
This article by Simply Wall St is general in nature. We provide commentary based on historical data and analyst forecasts only using an unbiased methodology and our articles are not intended to be financial advice. It does not constitute a recommendation to buy or sell any stock, and does not take account of your objectives, or your financial situation. We aim to bring you long-term focused analysis driven by fundamental data. Note that our analysis may not factor in the latest price-sensitive company announcements or qualitative material. Simply Wall St has no position in any stocks mentioned.
About OB:BRG
Borregaard
Engages in the development, production, and marketing of specialized biochemicals and biomaterials in Norway, rest of Europe, Asia, the United States, and internationally.
Flawless balance sheet and fair value.
Similar Companies
Market Insights

Advertisement
Community Narratives
Kodiak AI - a potential 100 bagger opportunity?
Fair Value US$14.00|44.7% undervalued
DA
Community Contributor
A Fair Price for a Great Business Facing Real Threats
Fair Value US$383.06|13.0% undervalued
IM
Community Contributor
AXON And Shopify Integration Will Unlock Global Mobile Advertising
Fair Value US$646.30|0% overvalued
AN
Based on Analyst Price Targets