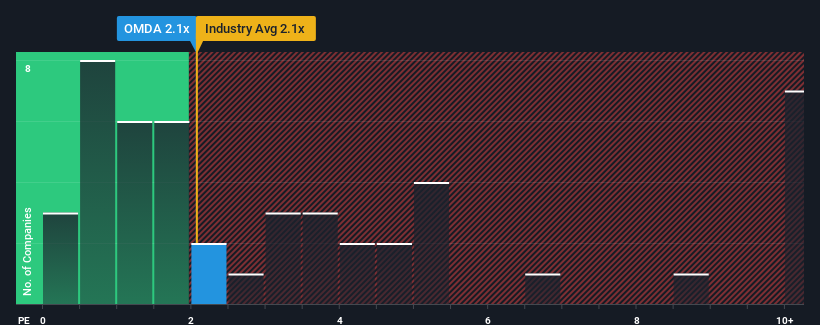
When close to half the companies operating in the Healthcare Services industry in Norway have price-to-sales ratios (or "P/S") above 3.8x, you may consider Omda AS (OB:OMDA) as an attractive investment with its 2.1x P/S ratio. Nonetheless, we'd need to dig a little deeper to determine if there is a rational basis for the reduced P/S.
See our latest analysis for Omda

What Does Omda's Recent Performance Look Like?
Recent times haven't been great for Omda as its revenue has been rising slower than most other companies. It seems that many are expecting the uninspiring revenue performance to persist, which has repressed the growth of the P/S ratio. If you still like the company, you'd be hoping revenue doesn't get any worse and that you could pick up some stock while it's out of favour.
Keen to find out how analysts think Omda's future stacks up against the industry? In that case, our free report is a great place to start.What Are Revenue Growth Metrics Telling Us About The Low P/S?
Omda's P/S ratio would be typical for a company that's only expected to deliver limited growth, and importantly, perform worse than the industry.
Retrospectively, the last year delivered a decent 12% gain to the company's revenues. The latest three year period has also seen an excellent 74% overall rise in revenue, aided somewhat by its short-term performance. So we can start by confirming that the company has done a great job of growing revenues over that time.
Looking ahead now, revenue is anticipated to climb by 10% per year during the coming three years according to the dual analysts following the company. Meanwhile, the rest of the industry is forecast to expand by 9.1% per year, which is not materially different.
With this information, we find it odd that Omda is trading at a P/S lower than the industry. Apparently some shareholders are doubtful of the forecasts and have been accepting lower selling prices.
The Key Takeaway
Typically, we'd caution against reading too much into price-to-sales ratios when settling on investment decisions, though it can reveal plenty about what other market participants think about the company.
It looks to us like the P/S figures for Omda remain low despite growth that is expected to be in line with other companies in the industry. When we see middle-of-the-road revenue growth like this, we assume it must be the potential risks that are what is placing pressure on the P/S ratio. It appears some are indeed anticipating revenue instability, because these conditions should normally provide more support to the share price.
You should always think about risks. Case in point, we've spotted 5 warning signs for Omda you should be aware of, and 3 of them are concerning.
If strong companies turning a profit tickle your fancy, then you'll want to check out this free list of interesting companies that trade on a low P/E (but have proven they can grow earnings).
New: AI Stock Screener & Alerts
Our new AI Stock Screener scans the market every day to uncover opportunities.
• Dividend Powerhouses (3%+ Yield)
• Undervalued Small Caps with Insider Buying
• High growth Tech and AI Companies
Or build your own from over 50 metrics.
Have feedback on this article? Concerned about the content? Get in touch with us directly. Alternatively, email editorial-team (at) simplywallst.com.
This article by Simply Wall St is general in nature. We provide commentary based on historical data and analyst forecasts only using an unbiased methodology and our articles are not intended to be financial advice. It does not constitute a recommendation to buy or sell any stock, and does not take account of your objectives, or your financial situation. We aim to bring you long-term focused analysis driven by fundamental data. Note that our analysis may not factor in the latest price-sensitive company announcements or qualitative material. Simply Wall St has no position in any stocks mentioned.
About OB:OMDA
Omda
Provides software solutions for healthcare sector in Norway, Sweden, Denmark, Finland, and internationally.
Reasonable growth potential and fair value.
Market Insights
Community Narratives


