

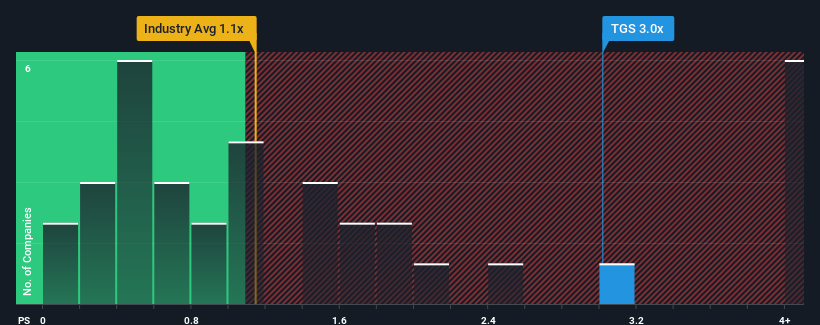
TGS ASA's (OB:TGS) price-to-sales (or "P/S") ratio of 3x may not look like an appealing investment opportunity when you consider close to half the companies in the Energy Services industry in Norway have P/S ratios below 1.1x. However, the P/S might be high for a reason and it requires further investigation to determine if it's justified.
Check out our latest analysis for TGS
What Does TGS' Recent Performance Look Like?
Recent times haven't been great for TGS as its revenue has been rising slower than most other companies. It might be that many expect the uninspiring revenue performance to recover significantly, which has kept the P/S ratio from collapsing. If not, then existing shareholders may be very nervous about the viability of the share price.
Want the full picture on analyst estimates for the company? Then our free report on TGS will help you uncover what's on the horizon.What Are Revenue Growth Metrics Telling Us About The High P/S?
TGS' P/S ratio would be typical for a company that's expected to deliver solid growth, and importantly, perform better than the industry.
If we review the last year of revenue, the company posted a result that saw barely any deviation from a year ago. Still, the latest three year period has seen an excellent 72% overall rise in revenue, in spite of its uninspiring short-term performance. Accordingly, shareholders will be pleased, but also have some questions to ponder about the last 12 months.
Turning to the outlook, the next year should generate growth of 31% as estimated by the five analysts watching the company. Meanwhile, the rest of the industry is forecast to only expand by 13%, which is noticeably less attractive.
With this information, we can see why TGS is trading at such a high P/S compared to the industry. Apparently shareholders aren't keen to offload something that is potentially eyeing a more prosperous future.
The Key Takeaway
We'd say the price-to-sales ratio's power isn't primarily as a valuation instrument but rather to gauge current investor sentiment and future expectations.
Our look into TGS shows that its P/S ratio remains high on the merit of its strong future revenues. At this stage investors feel the potential for a deterioration in revenues is quite remote, justifying the elevated P/S ratio. Unless the analysts have really missed the mark, these strong revenue forecasts should keep the share price buoyant.
Having said that, be aware TGS is showing 4 warning signs in our investment analysis, and 2 of those are significant.
If these risks are making you reconsider your opinion on TGS, explore our interactive list of high quality stocks to get an idea of what else is out there.
Valuation is complex, but we're here to simplify it.
Discover if TGS might be undervalued or overvalued with our detailed analysis, featuring fair value estimates, potential risks, dividends, insider trades, and its financial condition.
Access Free AnalysisHave feedback on this article? Concerned about the content? Get in touch with us directly. Alternatively, email editorial-team (at) simplywallst.com.
This article by Simply Wall St is general in nature. We provide commentary based on historical data and analyst forecasts only using an unbiased methodology and our articles are not intended to be financial advice. It does not constitute a recommendation to buy or sell any stock, and does not take account of your objectives, or your financial situation. We aim to bring you long-term focused analysis driven by fundamental data. Note that our analysis may not factor in the latest price-sensitive company announcements or qualitative material. Simply Wall St has no position in any stocks mentioned.
Have feedback on this article? Concerned about the content? Get in touch with us directly. Alternatively, email editorial-team@simplywallst.com
About OB:TGS
TGS
Provides geoscience data services to the oil and gas industry in Norway and internationally.
Reasonable growth potential with proven track record.
Similar Companies
Market Insights

Community Narratives

