

Legendary fund manager Li Lu (who Charlie Munger backed) once said, 'The biggest investment risk is not the volatility of prices, but whether you will suffer a permanent loss of capital.' So it might be obvious that you need to consider debt, when you think about how risky any given stock is, because too much debt can sink a company. We can see that TGS ASA (OB:TGS) does use debt in its business. But the more important question is: how much risk is that debt creating?
Why Does Debt Bring Risk?
Debt assists a business until the business has trouble paying it off, either with new capital or with free cash flow. Part and parcel of capitalism is the process of 'creative destruction' where failed businesses are mercilessly liquidated by their bankers. However, a more frequent (but still costly) occurrence is where a company must issue shares at bargain-basement prices, permanently diluting shareholders, just to shore up its balance sheet. Having said that, the most common situation is where a company manages its debt reasonably well - and to its own advantage. The first step when considering a company's debt levels is to consider its cash and debt together.
Check out our latest analysis for TGS
What Is TGS's Net Debt?
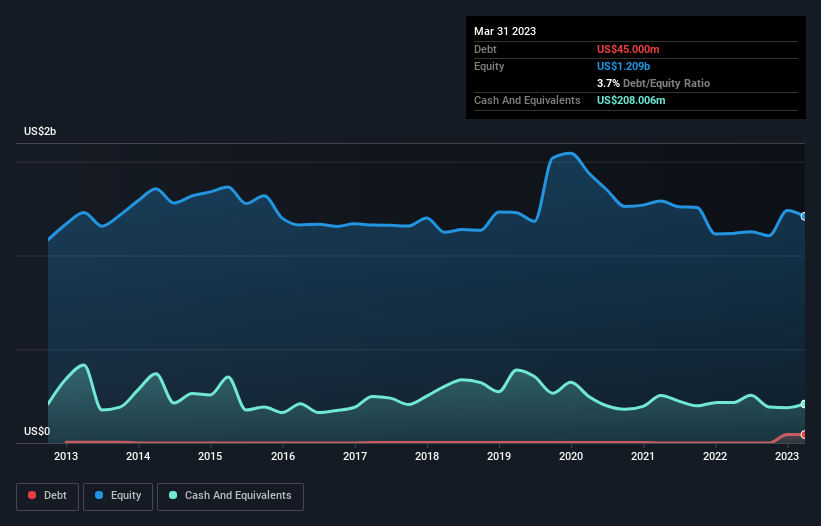
As you can see below, at the end of March 2023, TGS had US$45.0m of debt, up from none a year ago. Click the image for more detail. However, it does have US$208.0m in cash offsetting this, leading to net cash of US$163.0m.
How Strong Is TGS' Balance Sheet?
According to the last reported balance sheet, TGS had liabilities of US$561.1m due within 12 months, and liabilities of US$96.5m due beyond 12 months. Offsetting these obligations, it had cash of US$208.0m as well as receivables valued at US$164.2m due within 12 months. So its liabilities outweigh the sum of its cash and (near-term) receivables by US$285.4m.
Given TGS has a market capitalization of US$1.68b, it's hard to believe these liabilities pose much threat. However, we do think it is worth keeping an eye on its balance sheet strength, as it may change over time. Despite its noteworthy liabilities, TGS boasts net cash, so it's fair to say it does not have a heavy debt load!
Another good sign is that TGS has been able to increase its EBIT by 22% in twelve months, making it easier to pay down debt. The balance sheet is clearly the area to focus on when you are analysing debt. But it is future earnings, more than anything, that will determine TGS's ability to maintain a healthy balance sheet going forward. So if you're focused on the future you can check out this free report showing analyst profit forecasts.
Finally, a business needs free cash flow to pay off debt; accounting profits just don't cut it. TGS may have net cash on the balance sheet, but it is still interesting to look at how well the business converts its earnings before interest and tax (EBIT) to free cash flow, because that will influence both its need for, and its capacity to manage debt. Over the most recent three years, TGS recorded free cash flow worth 58% of its EBIT, which is around normal, given free cash flow excludes interest and tax. This free cash flow puts the company in a good position to pay down debt, when appropriate.
Summing Up
While TGS does have more liabilities than liquid assets, it also has net cash of US$163.0m. And it impressed us with its EBIT growth of 22% over the last year. So we don't think TGS's use of debt is risky. The balance sheet is clearly the area to focus on when you are analysing debt. However, not all investment risk resides within the balance sheet - far from it. For instance, we've identified 3 warning signs for TGS that you should be aware of.
If you're interested in investing in businesses that can grow profits without the burden of debt, then check out this free list of growing businesses that have net cash on the balance sheet.
If you're looking to trade TGS, open an account with the lowest-cost platform trusted by professionals, Interactive Brokers.
With clients in over 200 countries and territories, and access to 160 markets, IBKR lets you trade stocks, options, futures, forex, bonds and funds from a single integrated account.
Enjoy no hidden fees, no account minimums, and FX conversion rates as low as 0.03%, far better than what most brokers offer.
Sponsored ContentValuation is complex, but we're here to simplify it.
Discover if TGS might be undervalued or overvalued with our detailed analysis, featuring fair value estimates, potential risks, dividends, insider trades, and its financial condition.
Access Free AnalysisHave feedback on this article? Concerned about the content? Get in touch with us directly. Alternatively, email editorial-team (at) simplywallst.com.
This article by Simply Wall St is general in nature. We provide commentary based on historical data and analyst forecasts only using an unbiased methodology and our articles are not intended to be financial advice. It does not constitute a recommendation to buy or sell any stock, and does not take account of your objectives, or your financial situation. We aim to bring you long-term focused analysis driven by fundamental data. Note that our analysis may not factor in the latest price-sensitive company announcements or qualitative material. Simply Wall St has no position in any stocks mentioned.
About OB:TGS
TGS
Provides geoscience data services to the oil and gas industry in Norway and internationally.
Reasonable growth potential with proven track record.
Similar Companies
Market Insights

Community Narratives

