
Advertisement
- Norway
- /
- Energy Services
- /
- OB:TGS
Is TGS ASA's (OB:TGS) Stock On A Downtrend As A Result Of Its Poor Financials?
TGS (OB:TGS) has had a rough three months with its share price down 20%. To decide if this trend could continue, we decided to look at its weak fundamentals as they shape the long-term market trends. Particularly, we will be paying attention to TGS' ROE today.
ROE or return on equity is a useful tool to assess how effectively a company can generate returns on the investment it received from its shareholders. In short, ROE shows the profit each dollar generates with respect to its shareholder investments.
Check out our latest analysis for TGS
How Is ROE Calculated?
The formula for return on equity is:
Return on Equity = Net Profit (from continuing operations) ÷ Shareholders' Equity
So, based on the above formula, the ROE for TGS is:
2.1% = US$26m ÷ US$1.3b (Based on the trailing twelve months to June 2024).
The 'return' is the yearly profit. Another way to think of that is that for every NOK1 worth of equity, the company was able to earn NOK0.02 in profit.
What Is The Relationship Between ROE And Earnings Growth?
So far, we've learned that ROE is a measure of a company's profitability. We now need to evaluate how much profit the company reinvests or "retains" for future growth which then gives us an idea about the growth potential of the company. Assuming all else is equal, companies that have both a higher return on equity and higher profit retention are usually the ones that have a higher growth rate when compared to companies that don't have the same features.
TGS' Earnings Growth And 2.1% ROE
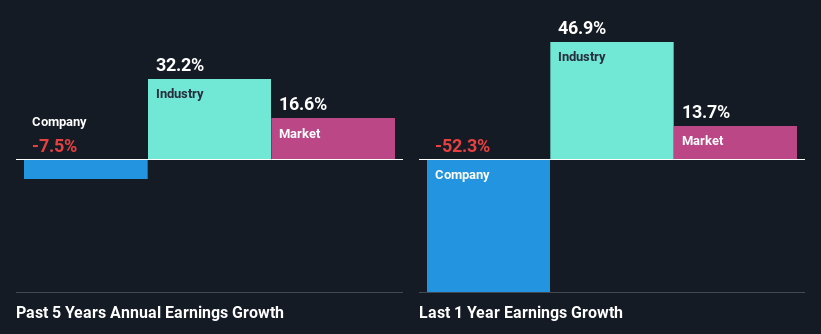
As you can see, TGS' ROE looks pretty weak. Not just that, even compared to the industry average of 9.8%, the company's ROE is entirely unremarkable. For this reason, TGS' five year net income decline of 7.5% is not surprising given its lower ROE. We believe that there also might be other aspects that are negatively influencing the company's earnings prospects. Such as - low earnings retention or poor allocation of capital.
So, as a next step, we compared TGS' performance against the industry and were disappointed to discover that while the company has been shrinking its earnings, the industry has been growing its earnings at a rate of 32% over the last few years.
Earnings growth is an important metric to consider when valuing a stock. What investors need to determine next is if the expected earnings growth, or the lack of it, is already built into the share price. This then helps them determine if the stock is placed for a bright or bleak future. One good indicator of expected earnings growth is the P/E ratio which determines the price the market is willing to pay for a stock based on its earnings prospects. So, you may want to check if TGS is trading on a high P/E or a low P/E, relative to its industry.
Is TGS Using Its Retained Earnings Effectively?
TGS has a high three-year median payout ratio of 95% (that is, it is retaining 5.0% of its profits). This suggests that the company is paying most of its profits as dividends to its shareholders. This goes some way in explaining why its earnings have been shrinking. With only very little left to reinvest into the business, growth in earnings is far from likely. You can see the 4 risks we have identified for TGS by visiting our risks dashboard for free on our platform here.
Additionally, TGS has paid dividends over a period of at least ten years, which means that the company's management is determined to pay dividends even if it means little to no earnings growth. Our latest analyst data shows that the future payout ratio of the company is expected to drop to 34% over the next three years. Accordingly, the expected drop in the payout ratio explains the expected increase in the company's ROE to 11%, over the same period.
Summary
On the whole, TGS' performance is quite a big let-down. Particularly, its ROE is a huge disappointment, not to mention its lack of proper reinvestment into the business. As a result its earnings growth has also been quite disappointing. Having said that, looking at current analyst estimates, we found that the company's earnings growth rate is expected to see a huge improvement. To know more about the latest analysts predictions for the company, check out this visualization of analyst forecasts for the company.
Valuation is complex, but we're here to simplify it.
Discover if TGS might be undervalued or overvalued with our detailed analysis, featuring fair value estimates, potential risks, dividends, insider trades, and its financial condition.
Access Free AnalysisHave feedback on this article? Concerned about the content? Get in touch with us directly. Alternatively, email editorial-team (at) simplywallst.com.
This article by Simply Wall St is general in nature. We provide commentary based on historical data and analyst forecasts only using an unbiased methodology and our articles are not intended to be financial advice. It does not constitute a recommendation to buy or sell any stock, and does not take account of your objectives, or your financial situation. We aim to bring you long-term focused analysis driven by fundamental data. Note that our analysis may not factor in the latest price-sensitive company announcements or qualitative material. Simply Wall St has no position in any stocks mentioned.
About OB:TGS
TGS
Provides geoscience data services to the oil and gas industry in Norway and internationally.
Moderate growth potential with mediocre balance sheet.
Similar Companies
Market Insights

Advertisement
Community Narratives
Quality at a Premium. A time to watch, not to buy?
Fair Value US$154.56|30.1% undervalued
DA
Community Contributor
GRAB: The Super-App at the Heart of Southeast Asia’s Digital Boom
Fair Value US$8.20|25.6% undervalued
BL
Community Contributor
Verve Group to Surge with 51.61% Revenue Growth
Fair Value €6.00|63.2% undervalued
ME
Community Contributor