- Norway
- /
- Energy Services
- /
- OB:TGS
Investors in TGS (OB:TGS) from three years ago are still down 36%, even after 6.0% gain this past week


TGS ASA (OB:TGS) shareholders should be happy to see the share price up 12% in the last month. But that cannot eclipse the less-than-impressive returns over the last three years. Truth be told the share price declined 44% in three years and that return, Dear Reader, falls short of what you could have got from passive investing with an index fund.
While the stock has risen 6.0% in the past week but long term shareholders are still in the red, let's see what the fundamentals can tell us.
We've discovered 3 warning signs about TGS. View them for free.To quote Buffett, 'Ships will sail around the world but the Flat Earth Society will flourish. There will continue to be wide discrepancies between price and value in the marketplace...' One imperfect but simple way to consider how the market perception of a company has shifted is to compare the change in the earnings per share (EPS) with the share price movement.
During five years of share price growth, TGS moved from a loss to profitability. We would usually expect to see the share price rise as a result. So given the share price is down it's worth checking some other metrics too.
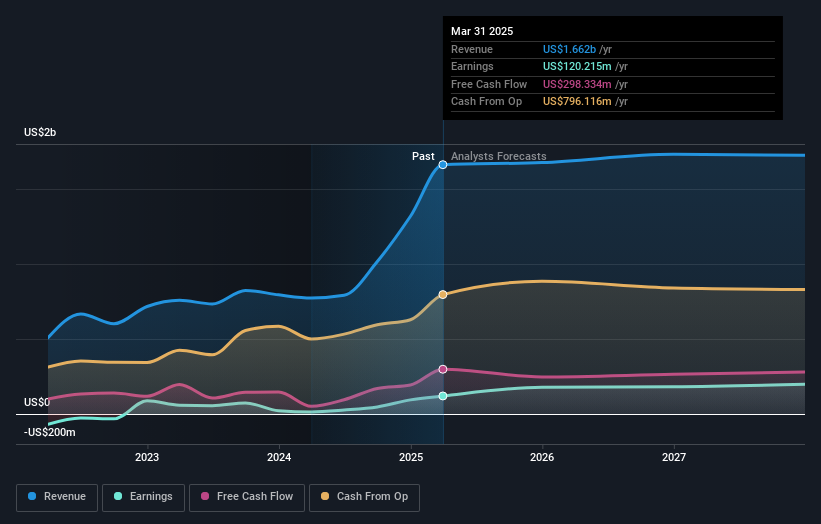
It's quite likely that the declining dividend has caused some investors to sell their shares, pushing the price lower in the process. In contrast it does not seem particularly likely that the revenue levels are a concern for investors.
The graphic below depicts how earnings and revenue have changed over time (unveil the exact values by clicking on the image).
It's probably worth noting we've seen significant insider buying in the last quarter, which we consider a positive. On the other hand, we think the revenue and earnings trends are much more meaningful measures of the business. So it makes a lot of sense to check out what analysts think TGS will earn in the future (free profit forecasts).
What About Dividends?
It is important to consider the total shareholder return, as well as the share price return, for any given stock. The TSR is a return calculation that accounts for the value of cash dividends (assuming that any dividend received was reinvested) and the calculated value of any discounted capital raisings and spin-offs. Arguably, the TSR gives a more comprehensive picture of the return generated by a stock. In the case of TGS, it has a TSR of -36% for the last 3 years. That exceeds its share price return that we previously mentioned. The dividends paid by the company have thusly boosted the total shareholder return.
A Different Perspective
While the broader market gained around 4.8% in the last year, TGS shareholders lost 27% (even including dividends). However, keep in mind that even the best stocks will sometimes underperform the market over a twelve month period. Unfortunately, last year's performance may indicate unresolved challenges, given that it was worse than the annualised loss of 5% over the last half decade. Generally speaking long term share price weakness can be a bad sign, though contrarian investors might want to research the stock in hope of a turnaround. It's always interesting to track share price performance over the longer term. But to understand TGS better, we need to consider many other factors. To that end, you should learn about the 3 warning signs we've spotted with TGS (including 1 which is potentially serious) .
TGS is not the only stock insiders are buying. So take a peek at this free list of small cap companies at attractive valuations which insiders have been buying.
Please note, the market returns quoted in this article reflect the market weighted average returns of stocks that currently trade on Norwegian exchanges.
If you're looking to trade TGS, open an account with the lowest-cost platform trusted by professionals, Interactive Brokers.
With clients in over 200 countries and territories, and access to 160 markets, IBKR lets you trade stocks, options, futures, forex, bonds and funds from a single integrated account.
Enjoy no hidden fees, no account minimums, and FX conversion rates as low as 0.03%, far better than what most brokers offer.
Sponsored ContentValuation is complex, but we're here to simplify it.
Discover if TGS might be undervalued or overvalued with our detailed analysis, featuring fair value estimates, potential risks, dividends, insider trades, and its financial condition.
Access Free AnalysisHave feedback on this article? Concerned about the content? Get in touch with us directly. Alternatively, email editorial-team (at) simplywallst.com.
This article by Simply Wall St is general in nature. We provide commentary based on historical data and analyst forecasts only using an unbiased methodology and our articles are not intended to be financial advice. It does not constitute a recommendation to buy or sell any stock, and does not take account of your objectives, or your financial situation. We aim to bring you long-term focused analysis driven by fundamental data. Note that our analysis may not factor in the latest price-sensitive company announcements or qualitative material. Simply Wall St has no position in any stocks mentioned.
About OB:TGS
TGS
Provides geoscience data services to the oil and gas industry in Norway and internationally.
Proven track record with moderate growth potential.
Similar Companies
Market Insights

Community Narratives

