
Advertisement
- Norway
- /
- Oil and Gas
- /
- OB:IOX
Interoil Exploration and Production ASA (OB:IOX) Might Not Be As Mispriced As It Looks After Plunging 34%
Unfortunately for some shareholders, the Interoil Exploration and Production ASA (OB:IOX) share price has dived 34% in the last thirty days, prolonging recent pain. The recent drop completes a disastrous twelve months for shareholders, who are sitting on a 71% loss during that time.
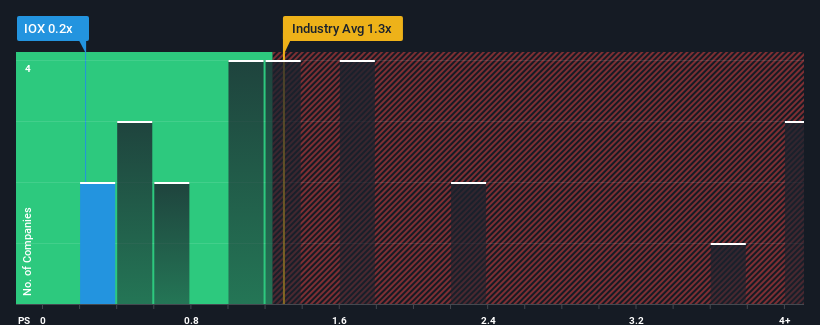
Since its price has dipped substantially, when close to half the companies operating in Norway's Oil and Gas industry have price-to-sales ratios (or "P/S") above 1.3x, you may consider Interoil Exploration and Production as an enticing stock to check out with its 0.2x P/S ratio. However, the P/S might be low for a reason and it requires further investigation to determine if it's justified.
View our latest analysis for Interoil Exploration and Production
What Does Interoil Exploration and Production's P/S Mean For Shareholders?
Interoil Exploration and Production has been doing a good job lately as it's been growing revenue at a solid pace. One possibility is that the P/S is low because investors think this respectable revenue growth might actually underperform the broader industry in the near future. If that doesn't eventuate, then existing shareholders have reason to be optimistic about the future direction of the share price.
Although there are no analyst estimates available for Interoil Exploration and Production, take a look at this free data-rich visualisation to see how the company stacks up on earnings, revenue and cash flow.Do Revenue Forecasts Match The Low P/S Ratio?
In order to justify its P/S ratio, Interoil Exploration and Production would need to produce sluggish growth that's trailing the industry.
Retrospectively, the last year delivered an exceptional 26% gain to the company's top line. The strong recent performance means it was also able to grow revenue by 167% in total over the last three years. Therefore, it's fair to say the revenue growth recently has been superb for the company.
Comparing that to the industry, which is predicted to shrink 4.1% in the next 12 months, the company's positive momentum based on recent medium-term revenue results is a bright spot for the moment.
With this information, we find it very odd that Interoil Exploration and Production is trading at a P/S lower than the industry. It looks like most investors are not convinced at all that the company can maintain its recent positive growth rate in the face of a shrinking broader industry.
What We Can Learn From Interoil Exploration and Production's P/S?
Interoil Exploration and Production's P/S has taken a dip along with its share price. We'd say the price-to-sales ratio's power isn't primarily as a valuation instrument but rather to gauge current investor sentiment and future expectations.
Our examination of Interoil Exploration and Production revealed that despite growing revenue over the medium-term in a shrinking industry, the P/S doesn't reflect this as it's lower than the industry average. One assumption would be that there are some underlying risks to revenue that are keeping the P/S from rising to match the its strong performance. The most obvious risk is that its revenue trajectory may not keep outperforming under these tough industry conditions. At least the risk of a price drop looks to be subdued, but investors think future revenue could see a lot of volatility.
You should always think about risks. Case in point, we've spotted 5 warning signs for Interoil Exploration and Production you should be aware of, and 2 of them are concerning.
If strong companies turning a profit tickle your fancy, then you'll want to check out this free list of interesting companies that trade on a low P/E (but have proven they can grow earnings).
New: AI Stock Screener & Alerts
Our new AI Stock Screener scans the market every day to uncover opportunities.
• Dividend Powerhouses (3%+ Yield)
• Undervalued Small Caps with Insider Buying
• High growth Tech and AI Companies
Or build your own from over 50 metrics.
Have feedback on this article? Concerned about the content? Get in touch with us directly. Alternatively, email editorial-team (at) simplywallst.com.
This article by Simply Wall St is general in nature. We provide commentary based on historical data and analyst forecasts only using an unbiased methodology and our articles are not intended to be financial advice. It does not constitute a recommendation to buy or sell any stock, and does not take account of your objectives, or your financial situation. We aim to bring you long-term focused analysis driven by fundamental data. Note that our analysis may not factor in the latest price-sensitive company announcements or qualitative material. Simply Wall St has no position in any stocks mentioned.
About OB:IOX
Interoil Exploration and Production
Operates as an upstream oil exploration and production company in Argentina and Colombia.
Slight risk and slightly overvalued.
Market Insights

Advertisement
Community Narratives
Finding The True Value Of A Logistics Powerhouse
Fair Value US$95.21|8.6% undervalued
NV
Community Contributor
Paradigm Biopharmaceuticals Will Lead Osteoarthritis Treatment with Zilosul's FDA Success
Fair Value AU$5.50|92.1% undervalued
AM
Community Contributor
Barrick Mining (ABX:CA): A Gold Hedge against a U.S. Shutdown
Fair Value CA$60.00|25.6% undervalued
GM
Community Contributor