- Norway
- /
- Oil and Gas
- /
- OB:GEOS
The Price Is Right For Golden Energy Offshore Services ASA (OB:GEOS) Even After Diving 26%


The Golden Energy Offshore Services ASA (OB:GEOS) share price has fared very poorly over the last month, falling by a substantial 26%. The drop over the last 30 days has capped off a tough year for shareholders, with the share price down 20% in that time.
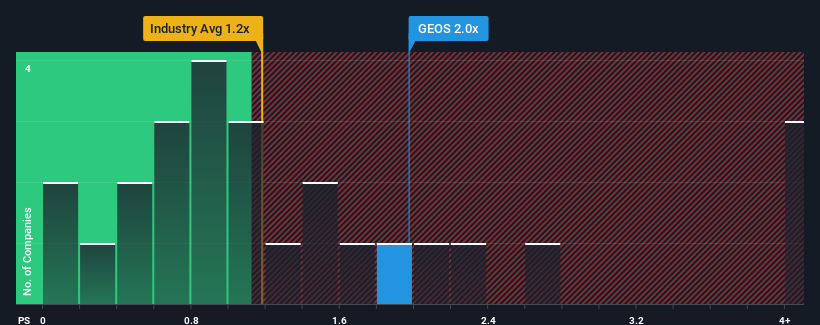
In spite of the heavy fall in price, you could still be forgiven for thinking Golden Energy Offshore Services is a stock not worth researching with a price-to-sales ratios (or "P/S") of 2x, considering almost half the companies in Norway's Oil and Gas industry have P/S ratios below 1.2x. Although, it's not wise to just take the P/S at face value as there may be an explanation why it's as high as it is.
Check out our latest analysis for Golden Energy Offshore Services
What Does Golden Energy Offshore Services' P/S Mean For Shareholders?
Recent times have been quite advantageous for Golden Energy Offshore Services as its revenue has been rising very briskly. It seems that many are expecting the strong revenue performance to beat most other companies over the coming period, which has increased investors’ willingness to pay up for the stock. You'd really hope so, otherwise you're paying a pretty hefty price for no particular reason.
Although there are no analyst estimates available for Golden Energy Offshore Services, take a look at this free data-rich visualisation to see how the company stacks up on earnings, revenue and cash flow.Is There Enough Revenue Growth Forecasted For Golden Energy Offshore Services?
In order to justify its P/S ratio, Golden Energy Offshore Services would need to produce impressive growth in excess of the industry.
If we review the last year of revenue growth, the company posted a terrific increase of 58%. Spectacularly, three year revenue growth has ballooned by several orders of magnitude, thanks in part to the last 12 months of revenue growth. Therefore, it's fair to say the revenue growth recently has been superb for the company.
Comparing that to the industry, which is predicted to shrink 5.3% in the next 12 months, the company's positive momentum based on recent medium-term revenue results is a bright spot for the moment.
With this in mind, it's clear to us why Golden Energy Offshore Services' P/S exceeds that of its industry peers. Investors are willing to pay more for a stock they hope will buck the trend of the broader industry going backwards. Nonetheless, with most other businesses facing an uphill battle, staying on its current revenue path is no certainty.
What Does Golden Energy Offshore Services' P/S Mean For Investors?
Golden Energy Offshore Services' P/S remain high even after its stock plunged. Generally, our preference is to limit the use of the price-to-sales ratio to establishing what the market thinks about the overall health of a company.
As detailed previously, the strength of Golden Energy Offshore Services' recent revenue trends over the medium-term relative to a declining industry is part of the reason why it trades at a higher P/S than its industry counterparts. It could be said that investors feel this revenue growth will continue into the future, justifying a higher P/S ratio. However, it'd be fair to raise concerns over whether this level of revenue performance will continue given the harsh conditions facing the industry. If things remain consistent though, shareholders shouldn't expect any major share price shocks in the near term.
You need to take note of risks, for example - Golden Energy Offshore Services has 5 warning signs (and 3 which are significant) we think you should know about.
If you're unsure about the strength of Golden Energy Offshore Services' business, why not explore our interactive list of stocks with solid business fundamentals for some other companies you may have missed.
New: Manage All Your Stock Portfolios in One Place
We've created the ultimate portfolio companion for stock investors, and it's free.
• Connect an unlimited number of Portfolios and see your total in one currency
• Be alerted to new Warning Signs or Risks via email or mobile
• Track the Fair Value of your stocks
Have feedback on this article? Concerned about the content? Get in touch with us directly. Alternatively, email editorial-team (at) simplywallst.com.
This article by Simply Wall St is general in nature. We provide commentary based on historical data and analyst forecasts only using an unbiased methodology and our articles are not intended to be financial advice. It does not constitute a recommendation to buy or sell any stock, and does not take account of your objectives, or your financial situation. We aim to bring you long-term focused analysis driven by fundamental data. Note that our analysis may not factor in the latest price-sensitive company announcements or qualitative material. Simply Wall St has no position in any stocks mentioned.
About OB:GEOS
Golden Energy Offshore Services
Owns and operates offshore service vessels for the oil and gas service industry in the North Sea and the Caribbean.
Slightly overvalued with imperfect balance sheet.
Market Insights

Community Narratives


