
Advertisement

Key Insights
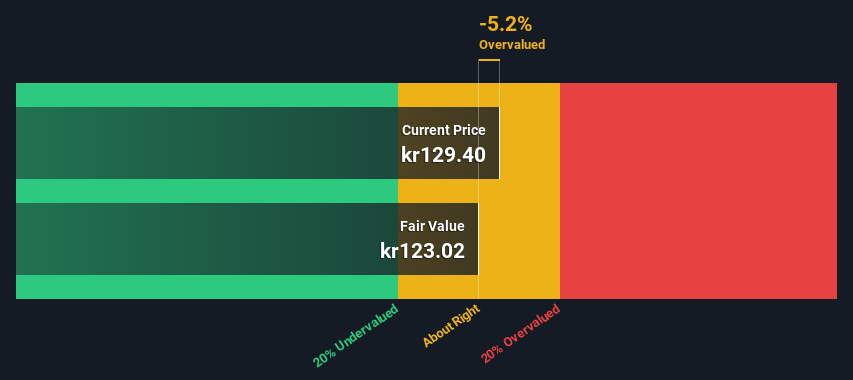
- The projected fair value for Avance Gas Holding is kr123 based on 2 Stage Free Cash Flow to Equity
- With kr129 share price, Avance Gas Holding appears to be trading close to its estimated fair value
- Our fair value estimate is 21% lower than Avance Gas Holding's analyst price target of US$156
Does the March share price for Avance Gas Holding Ltd (OB:AGAS) reflect what it's really worth? Today, we will estimate the stock's intrinsic value by taking the expected future cash flows and discounting them to today's value. Our analysis will employ the Discounted Cash Flow (DCF) model. There's really not all that much to it, even though it might appear quite complex.
Remember though, that there are many ways to estimate a company's value, and a DCF is just one method. Anyone interested in learning a bit more about intrinsic value should have a read of the Simply Wall St analysis model.
View our latest analysis for Avance Gas Holding
Step By Step Through The Calculation
We use what is known as a 2-stage model, which simply means we have two different periods of growth rates for the company's cash flows. Generally the first stage is higher growth, and the second stage is a lower growth phase. To begin with, we have to get estimates of the next ten years of cash flows. Where possible we use analyst estimates, but when these aren't available we extrapolate the previous free cash flow (FCF) from the last estimate or reported value. We assume companies with shrinking free cash flow will slow their rate of shrinkage, and that companies with growing free cash flow will see their growth rate slow, over this period. We do this to reflect that growth tends to slow more in the early years than it does in later years.
Generally we assume that a dollar today is more valuable than a dollar in the future, so we need to discount the sum of these future cash flows to arrive at a present value estimate:
10-year free cash flow (FCF) forecast
| 2024 | 2025 | 2026 | 2027 | 2028 | 2029 | 2030 | 2031 | 2032 | 2033 | |
| Levered FCF ($, Millions) | US$342.5m | US$71.0m | US$49.5m | US$46.3m | US$44.6m | US$43.6m | US$43.3m | US$43.3m | US$43.5m | US$44.0m |
| Growth Rate Estimate Source | Analyst x2 | Analyst x2 | Analyst x2 | Est @ -6.37% | Est @ -3.85% | Est @ -2.08% | Est @ -0.84% | Est @ 0.02% | Est @ 0.63% | Est @ 1.05% |
| Present Value ($, Millions) Discounted @ 8.5% | US$316 | US$60.3 | US$38.7 | US$33.4 | US$29.6 | US$26.7 | US$24.4 | US$22.5 | US$20.9 | US$19.5 |
("Est" = FCF growth rate estimated by Simply Wall St)
Present Value of 10-year Cash Flow (PVCF) = US$592m
The second stage is also known as Terminal Value, this is the business's cash flow after the first stage. For a number of reasons a very conservative growth rate is used that cannot exceed that of a country's GDP growth. In this case we have used the 5-year average of the 10-year government bond yield (2.0%) to estimate future growth. In the same way as with the 10-year 'growth' period, we discount future cash flows to today's value, using a cost of equity of 8.5%.
Terminal Value (TV)= FCF2033 × (1 + g) ÷ (r – g) = US$44m× (1 + 2.0%) ÷ (8.5%– 2.0%) = US$695m
Present Value of Terminal Value (PVTV)= TV / (1 + r)10= US$695m÷ ( 1 + 8.5%)10= US$307m
The total value, or equity value, is then the sum of the present value of the future cash flows, which in this case is US$899m. To get the intrinsic value per share, we divide this by the total number of shares outstanding. Compared to the current share price of kr129, the company appears around fair value at the time of writing. The assumptions in any calculation have a big impact on the valuation, so it is better to view this as a rough estimate, not precise down to the last cent.
The Assumptions
The calculation above is very dependent on two assumptions. The first is the discount rate and the other is the cash flows. Part of investing is coming up with your own evaluation of a company's future performance, so try the calculation yourself and check your own assumptions. The DCF also does not consider the possible cyclicality of an industry, or a company's future capital requirements, so it does not give a full picture of a company's potential performance. Given that we are looking at Avance Gas Holding as potential shareholders, the cost of equity is used as the discount rate, rather than the cost of capital (or weighted average cost of capital, WACC) which accounts for debt. In this calculation we've used 8.5%, which is based on a levered beta of 1.405. Beta is a measure of a stock's volatility, compared to the market as a whole. We get our beta from the industry average beta of globally comparable companies, with an imposed limit between 0.8 and 2.0, which is a reasonable range for a stable business.
SWOT Analysis for Avance Gas Holding
Strength
- Earnings growth over the past year exceeded the industry.
- Debt is well covered by earnings and cashflows.
- Dividend is in the top 25% of dividend payers in the market.
Weakness
- Expensive based on P/E ratio and estimated fair value.
Opportunity
- AGAS' financial characteristics indicate limited near-term opportunities for shareholders.
Threat
- Dividends are not covered by earnings.
- Annual earnings are forecast to decline for the next 3 years.
Next Steps:
Valuation is only one side of the coin in terms of building your investment thesis, and it is only one of many factors that you need to assess for a company. The DCF model is not a perfect stock valuation tool. Instead the best use for a DCF model is to test certain assumptions and theories to see if they would lead to the company being undervalued or overvalued. For example, changes in the company's cost of equity or the risk free rate can significantly impact the valuation. For Avance Gas Holding, there are three important items you should look at:
- Risks: For example, we've discovered 5 warning signs for Avance Gas Holding (3 make us uncomfortable!) that you should be aware of before investing here.
- Future Earnings: How does AGAS's growth rate compare to its peers and the wider market? Dig deeper into the analyst consensus number for the upcoming years by interacting with our free analyst growth expectation chart.
- Other Solid Businesses: Low debt, high returns on equity and good past performance are fundamental to a strong business. Why not explore our interactive list of stocks with solid business fundamentals to see if there are other companies you may not have considered!
PS. The Simply Wall St app conducts a discounted cash flow valuation for every stock on the OB every day. If you want to find the calculation for other stocks just search here.
New: Manage All Your Stock Portfolios in One Place
We've created the ultimate portfolio companion for stock investors, and it's free.
• Connect an unlimited number of Portfolios and see your total in one currency
• Be alerted to new Warning Signs or Risks via email or mobile
• Track the Fair Value of your stocks
Have feedback on this article? Concerned about the content? Get in touch with us directly. Alternatively, email editorial-team (at) simplywallst.com.
This article by Simply Wall St is general in nature. We provide commentary based on historical data and analyst forecasts only using an unbiased methodology and our articles are not intended to be financial advice. It does not constitute a recommendation to buy or sell any stock, and does not take account of your objectives, or your financial situation. We aim to bring you long-term focused analysis driven by fundamental data. Note that our analysis may not factor in the latest price-sensitive company announcements or qualitative material. Simply Wall St has no position in any stocks mentioned.
About OB:AGAS
Avance Gas Holding
Engages in the transportation of liquefied petroleum gas (LPG) worldwide.
Flawless balance sheet medium-low.
Similar Companies
Market Insights

Advertisement
Community Narratives
Groundbreaking therapies that could change the treatment landscape for PTSD, fibromyalgia, MS & Alzheimer’s
Fair Value US$6.20|86.9% undervalued
CM
Community Contributor
DigitalOcean Will Grow 14% by Embracing AI with Paperspace Acquisition
Fair Value US$50.00|40.2% undervalued
NE
Community Contributor
Viant Technology: A Rising AdTech Challenger in the AI-Powered CTV Market
Fair Value US$38.61|62.7% undervalued
BL
Community Contributor
Volvo will Accelerate Forward into Electric and Autonomous Leadership in Five Years
Fair Value SEK 438.80|40.1% undervalued
UN
Community Contributor