
Advertisement

Some say volatility, rather than debt, is the best way to think about risk as an investor, but Warren Buffett famously said that 'Volatility is far from synonymous with risk.' When we think about how risky a company is, we always like to look at its use of debt, since debt overload can lead to ruin. Importantly, Sats ASA (OB:SATS) does carry debt. But the more important question is: how much risk is that debt creating?
When Is Debt A Problem?
Debt and other liabilities become risky for a business when it cannot easily fulfill those obligations, either with free cash flow or by raising capital at an attractive price. If things get really bad, the lenders can take control of the business. However, a more frequent (but still costly) occurrence is where a company must issue shares at bargain-basement prices, permanently diluting shareholders, just to shore up its balance sheet. Of course, debt can be an important tool in businesses, particularly capital heavy businesses. The first thing to do when considering how much debt a business uses is to look at its cash and debt together.
See our latest analysis for Sats
How Much Debt Does Sats Carry?
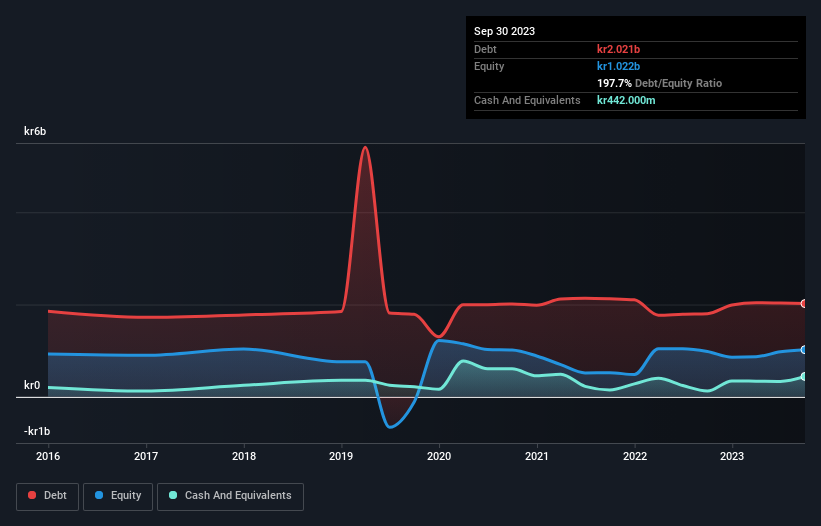
You can click the graphic below for the historical numbers, but it shows that as of September 2023 Sats had kr2.02b of debt, an increase on kr1.80b, over one year. On the flip side, it has kr442.0m in cash leading to net debt of about kr1.58b.
How Healthy Is Sats' Balance Sheet?
The latest balance sheet data shows that Sats had liabilities of kr1.98b due within a year, and liabilities of kr6.01b falling due after that. Offsetting this, it had kr442.0m in cash and kr187.0m in receivables that were due within 12 months. So it has liabilities totalling kr7.36b more than its cash and near-term receivables, combined.
This deficit casts a shadow over the kr2.40b company, like a colossus towering over mere mortals. So we definitely think shareholders need to watch this one closely. After all, Sats would likely require a major re-capitalisation if it had to pay its creditors today.
We measure a company's debt load relative to its earnings power by looking at its net debt divided by its earnings before interest, tax, depreciation, and amortization (EBITDA) and by calculating how easily its earnings before interest and tax (EBIT) cover its interest expense (interest cover). Thus we consider debt relative to earnings both with and without depreciation and amortization expenses.
Sats's debt of just -22.9 times EBITDA is clearly modest. But EBIT was only 1.9 times the interest expense last year, which shows that the debt has negatively impacted the business, by constraining its options (and restricting its free cash flow). Pleasingly, Sats is growing its EBIT faster than former Australian PM Bob Hawke downs a yard glass, boasting a 388% gain in the last twelve months. The balance sheet is clearly the area to focus on when you are analysing debt. But it is future earnings, more than anything, that will determine Sats's ability to maintain a healthy balance sheet going forward. So if you're focused on the future you can check out this free report showing analyst profit forecasts.
But our final consideration is also important, because a company cannot pay debt with paper profits; it needs cold hard cash. So it's worth checking how much of that EBIT is backed by free cash flow. Over the last two years, Sats actually produced more free cash flow than EBIT. That sort of strong cash generation warms our hearts like a puppy in a bumblebee suit.
Our View
We weren't impressed with Sats's interest cover, and its level of total liabilities made us cautious. But its net debt to EBITDA was significantly redeeming. Looking at all this data makes us feel a little cautious about Sats's debt levels. While we appreciate debt can enhance returns on equity, we'd suggest that shareholders keep close watch on its debt levels, lest they increase. When analysing debt levels, the balance sheet is the obvious place to start. However, not all investment risk resides within the balance sheet - far from it. Be aware that Sats is showing 2 warning signs in our investment analysis , and 1 of those makes us a bit uncomfortable...
Of course, if you're the type of investor who prefers buying stocks without the burden of debt, then don't hesitate to discover our exclusive list of net cash growth stocks, today.
New: Manage All Your Stock Portfolios in One Place
We've created the ultimate portfolio companion for stock investors, and it's free.
• Connect an unlimited number of Portfolios and see your total in one currency
• Be alerted to new Warning Signs or Risks via email or mobile
• Track the Fair Value of your stocks
Have feedback on this article? Concerned about the content? Get in touch with us directly. Alternatively, email editorial-team (at) simplywallst.com.
This article by Simply Wall St is general in nature. We provide commentary based on historical data and analyst forecasts only using an unbiased methodology and our articles are not intended to be financial advice. It does not constitute a recommendation to buy or sell any stock, and does not take account of your objectives, or your financial situation. We aim to bring you long-term focused analysis driven by fundamental data. Note that our analysis may not factor in the latest price-sensitive company announcements or qualitative material. Simply Wall St has no position in any stocks mentioned.
About OB:SATS
Sats
Provides fitness and training services in Norway, Sweden, Denmark, and Finland.
Reasonable growth potential with proven track record.
Similar Companies
Market Insights

Advertisement
Community Narratives
Groundbreaking therapies that could change the treatment landscape for PTSD, fibromyalgia, MS & Alzheimer’s
Fair Value US$6.20|86.9% undervalued
CM
Community Contributor
DigitalOcean Will Grow 14% by Embracing AI with Paperspace Acquisition
Fair Value US$50.00|42.8% undervalued
NE
Community Contributor
Viant Technology: A Rising AdTech Challenger in the AI-Powered CTV Market
Fair Value US$38.61|66.0% undervalued
BL
Community Contributor
Volvo will Accelerate Forward into Electric and Autonomous Leadership in Five Years
Fair Value SEK 438.80|40.8% undervalued
UN
Community Contributor